
The labor market rebounded in June. Here are the five things we learned from U.S. economic data released during the week ending July 5.
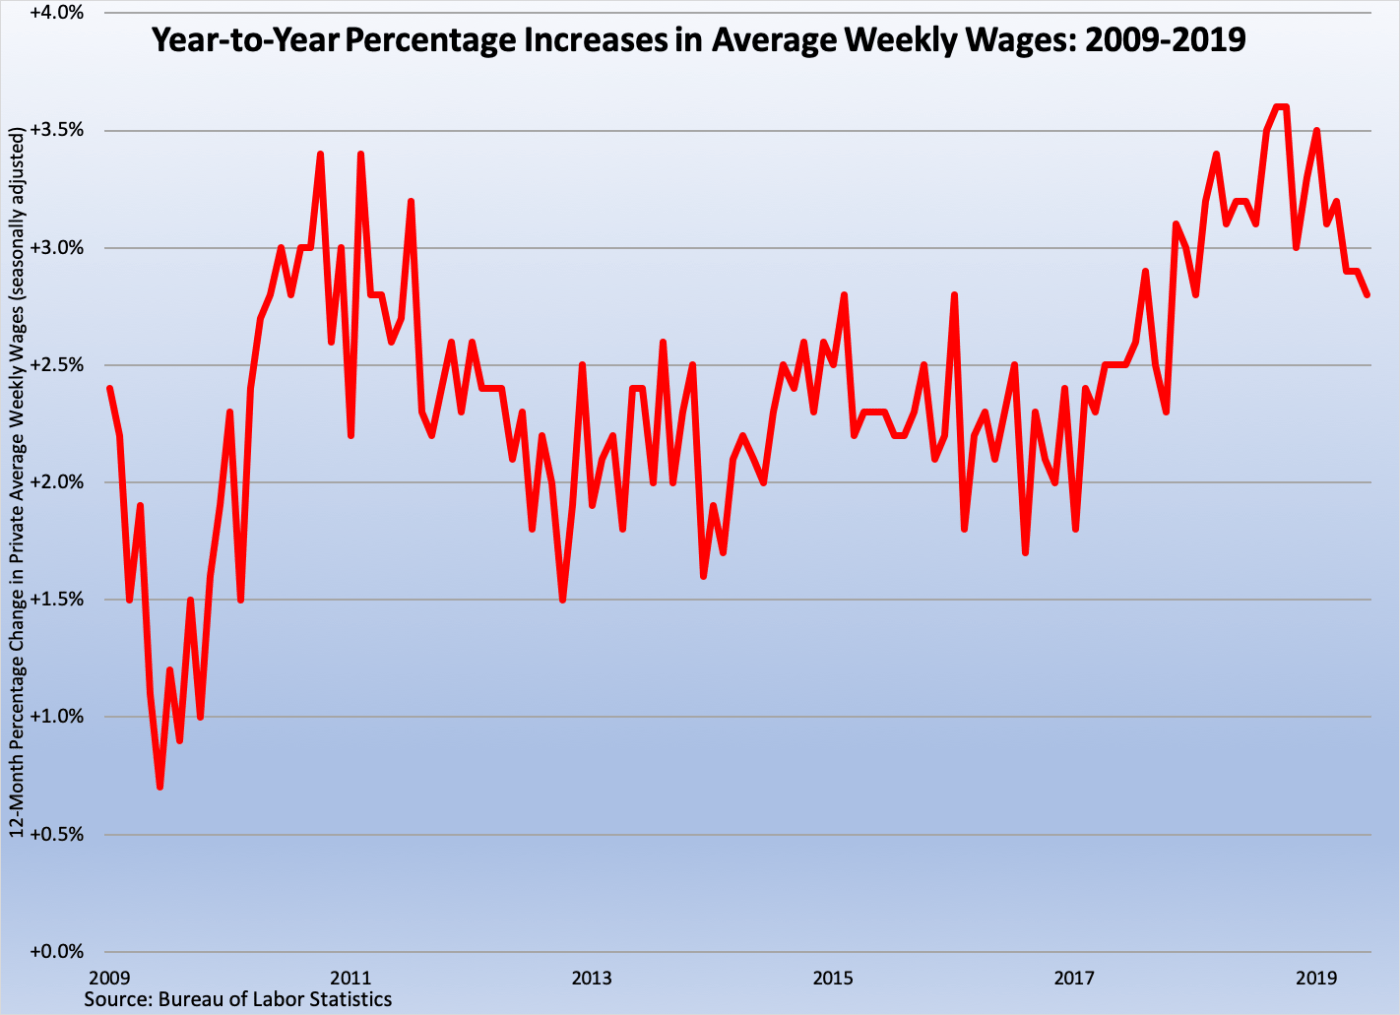
 Job creation recovered in June. The Bureau of Labor Statistics tells us that nonfarm payrolls expanded by a seasonally adjusted 224,000 during the month, a sharp surge versus May’s 72,000 created jobs and just above April’s 216,000 payrolls jump. Private sector employers added 191,000 workers (up from an 83,000 gain in May), split between 154,000 in the service sector and 37,000 in the goods-producing sector. Industries adding the most jobs in June included professional/business services (+51,000), health care/social assistance (+50,500), transportation/warehousing (+23,900), and construction (+21,000). Average weekly private sector earnings of $959.76 represented a 2.8 percent increase over the past year.
A separate survey of households has the unemployment rate inching up 1/10th of a percentage point to 3.7 percent (just above its multi-decade low) as 335,000 people entered the labor force during the month. The labor force participation rate grew by 1/10th of a percentage point to 62.9 percent—the same measure for adults aged 25 to 54 also added 1/10th of a percentage point to 82.2 percent. The median length of unemployment grew by a half week to 9.6 weeks while the number of part-time workers seeking a full-time opportunity essentially held steady at 4.347 million. The U-6 series, the broadest measure of labor underutilization published by BLS, eked out a 1/10th of a percentage point increase to 7.2 percent (just above its almost 19-year low achieved last month).
 The U.S. trade deficit hit a 2019 high in May. The Census Bureau and the Bureau of Economic Analysis report that while exports grew by $4.2 billion to a seasonally adjusted $210.6 billion (-1.3 percent versus May 2018), imports surged by $8.5 billion to $266.2 billion (+3.3 percent versus May 2018). The resulting trade deficit of -$55.5 billion was up $4.3 billion from April and was a five-month high. The goods deficit blossomed by $4.4 billion to -$76.1 billion while the services surplus widened slightly (+$0.1 billion) to +$20.6 billion. The former resulted from imports of goods swelling $8.1 billion (including from imported automobiles, crude oil, capital goods, and semiconductors), overwhelming the $4.0 billion increase in exported goods (including capital goods, consumer goods, soybeans, and automobiles). The U.S. had its largest goods deficits with China, the European Union, Mexico, and Japan.
 Factory orders dropped in May. New orders for manufactured goods decreased for the third time in four months with a 0.7 percent decline to a seasonally adjusted $493.6 billion, per the Census Bureau. Transportation goods orders shrank 4.6 percent, hurt by contracting orders for civilian (-28.2 percent) and defense (-15.5 percent) aircraft. Net of transportation orders inched up 0.1 percent, with increased orders for furniture (+3.3 percent), electrical equipment/appliances (+1.0 percent), machinery (+0.8 percent), computers/electronics (+0.7 percent), and primary metals (+0.1 percent). Declining were orders for fabricated metal products (-0.3 percent) and nondurables (-0.2 percent). Meanwhile, shipments grew 0.1 percent to $504.3 billion (its third gain in four months), with shipments unchanged for the month net of transportation goods. Unfilled orders declined 0.5 percent to $1.171 trillion (its third drop in four months) while inventories expanded for the eighth time in nine months with a 0.2 percent increase to $694.1 billion.
 Purchasing managers suggest a slower pace of economic growth in June. The Institute for Supply Management’s PMI (the headline index from its Manufacturing Report on Business) slipped by 4/10ths of a point to 51.7. While this was the PMI’s lowest reading since October 2016, it also was the measure’s 34th straight month above a reading of 50.0 (the threshold between an expanding and contracting manufacturing sector). Three of five PMI components took a step back in June—new orders, inventories, and supplier deliveries—while the other two—production and employment— both advanced. Twelve of 18 tracked manufacturing industries reported growth, led by furniture, printing, and textiles. The press release noted that survey respondents “expressed concern about U.S.-China trade turbulence, potential Mexico trade actions and the global economy.”
The NMI, the headline index from ISM’s Nonmanufacturing Report on Business, declined by 1.8 points in June to a reading of 55.1. The NMI has been above the critical 50.0 threshold for an impressive 113 months, but this is the measure’s lowest reading since July 2017. Only one NMI component (supplier deliveries) grew during the month, while the other three declined (employment, business activity/production, and new orders). Sixteen of 18 tracked nonmanufacturing industries reported growth, led by real estate. The press release characterized survey respondents’ sentiment as “mixed,” as a “degree of uncertainty exists due to trade and tariffs.”
 Construction spending decelerated in May. The Census Bureau places the seasonally adjusted annualized rate of construction put in place at $1.294 trillion, down 0.8 percent from April and 2.3 percent below the year-ago pace. Residential construction spending dropped 0.7 percent to an annualized $953.2 billion, 6.3 percent less than that of a year ago and its lowest reading since January 2017. Falling were spending on both private sector nonresidential (-0.9 percent) and residential (-0.6 percent) spending. Reversing recent trends, public sector construction spending also slowed, slumping 0.9 percent to an annualized $340.6 billion. Despite May’s decline, public construction spending remained 10.8 percent ahead of its year-ago pace.
Other U.S. economic data released over the past week:
– Jobless Claims (week ending June 29, 2019, First-Time Claims, seasonally adjusted): 221,000 (-8,000 vs. previous week; -8,000 vs. the same week a year earlier). 4-week moving average: 222,250 (-0.1% vs. the same week a year earlier)
The opinions expressed here are not necessarily those of Kevin’s current employer. No endorsements are implied.
