
Real consumer spending failed to grow in April. Here are the five things we learned from U.S. economic data released during the week ending May 31.
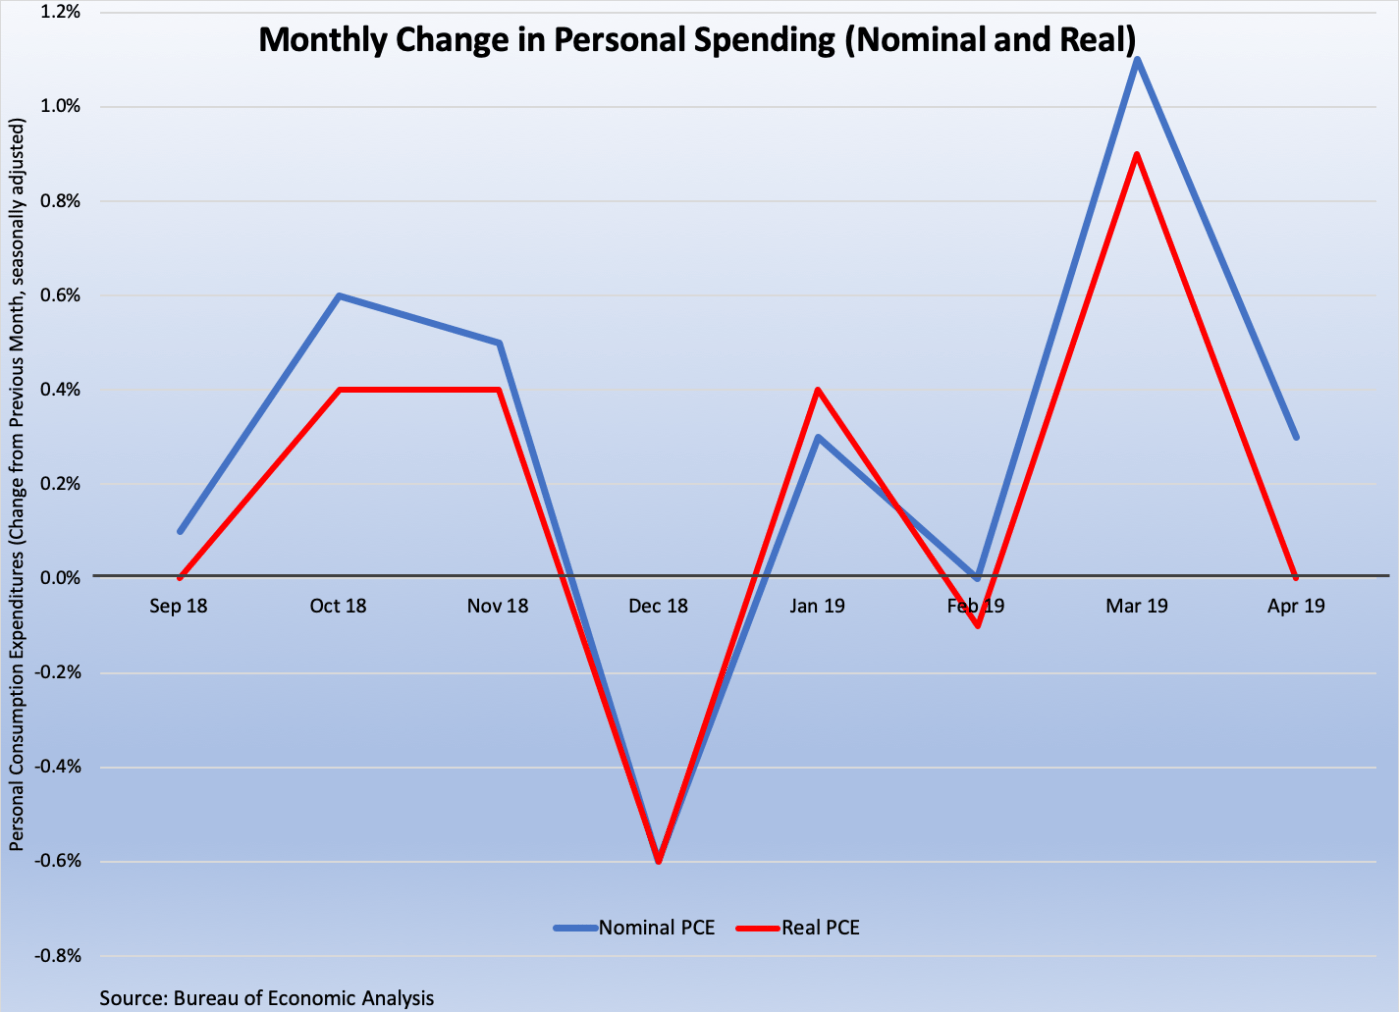
 Personal spending growth matched price gains in April. Real personal consumption expenditures (PCE) were unchanged on a seasonally adjusted basis during the month, down from a 0.9 percent jump in March. Real spending on goods grew 0.1 percent, as a 0.3 percent bounce in spending of nondurables outweighed a 0.4 percent drop for durables expenditures. Real spending on services slipped 0.1 percent. The same Bureau of Economic Analysis report has the PCE deflator, a measure of inflation, growing by 0.3 percent during the month, which means nominal (not price adjusted) personal spending rose 0.3 percent during the month. The increase in spending was funded by gains in nominal personal and disposable income of 0.5 percent and 0.4 percent, respectively. Real disposable income advanced 0.1 percent. The savings rate edged up by 1/10th of a percentage point to +6.2 percent. Over the past year, real disposable income has grown 2.2 percent, while real spending expanded 2.7 percent.
 A revision finds Q1 economic expansion was slightly less robust than previously believed. The Bureau of Economic Analysis lowered its growth estimate of first quarter 2019 Gross Domestic Product (GDP) from a seasonally adjusted annualized rate (SAAR) of +3.2 percent to +3.1 percent. The downward revision was the result of lower than previously believed levels of business investment and private inventory accumulation. Q1 GDP growth outpaced that of the final three months of 2018 (+2.2 percent) but was slower than that of Q2 (+4.2 percent) and Q3 (+3.4 percent). Contributors to Q1 economic growth were (in declining order) personal spending (adding 90-basis points to the increase in GDP), the change in private inventories (+60-basis points), exports (+58-basis points), imports (+39-basis points), government expenditures (+42-basis points), and fixed nonresidential investment (+31-basis points). Residential fixed investment—i.e., housing—subtracted 13-basis points from Q1 GDP growth. The same report included the BEA’s first estimate of Q1 corporate profits, which sank 2.8 percent from the prior quarter.
 Consumer sentiment firmed in May. The Conference Board’s Consumer Confidence Index added 4.9 points during the month to a seasonally adjusted reading of 134.1 (1985=100), near its 18-year high. The present conditions index added 6.2 points to 175.2 while the expectations index grew by 3.9 points to 106.6. 38.3 percent of survey respondents described current business conditions as “good” while only 10.2 percent seeing them as “bad.” Similarly, 47.2 percent of survey respondents viewed jobs as being “plentiful” versus only 10.9 percent sensing jobs were “hard to get.” The press release stated the results “suggest no significant pullback in consumer spending in the months ahead.
 …But one survey hints that confidence softened towards the end of the month. The Index of Consumer Sentiment from the University of Michigan came in at 100.0 (100=1966Q1), up 2.8 points from April 2019 and 2.0 points from May 2018. All of the increase came from a brighter outlook for the future as the expectations index surged by 5.9 points to 93.5 (May 2018: 89.1). The current conditions slipped 2.3 points to 110.0, which also was 1.8 points below its year-ago mark. The press release noted that even though the index had gained from April, “confidence significantly eroded in the last two weeks of May.”
 Home purchase contract activity slowed in April. The National Association of Realtors’ Pending Home Sales Index (PHSI) pulled back 1.5 percent during the month to a seasonally adjusted reading of 104.3 (2001=100). This left the measure of contract signings of previously owned homes 2.0 percent below from its year-ago reading. The PHSI grew 1.3 percent in the Midwest but lost ground in the South (-2.5 percent), Northeast (-1.8 percent), and West (-1.8 percent). The measure had negative 12-month comparables in all four Census regions. The press release said that despite the pullback in the PHSI, “it’s inevitable for sales to turn higher in a few months.”
Other U.S. economic data released over the past week:
– Jobless Claims (week ending May 25, 2019, First-Time Claims, seasonally adjusted): 215,000 (+3,000 vs. previous week; -6,000 vs. the same week a year earlier). 4-week moving average: 216,750 (-1.5% vs. the same week a year earlier).
– FHFA House Price Index (March 2019, Purchase-Only Index, seasonally adjusted): +0.1% vs. February 2019, +4.9% vs. March 2018.
– Case-Shiller Home Price Index (March 2019, 20-City Index, seasonally adjusted): +0.1% vs. February 2019, +2.7% vs. March 2018.
– Agricultural Prices (April 2019, Prices Received by Farmers): +1.1% vs. March 2019, +0.1% vs. April 2018.
The opinions expressed here are not necessarily those of Kevin’s current employer. No endorsements are implied.
