
We get another small upward revision in Q1 GDP, we see that consumer spending grew in May, and we hear that June may have been a decent month for manufacturing. Here are the 5 things we learned from U.S. economic data released during the week ending July 1.
 Even after a small upward revision in GDP, Q1 economic growth was weak. The 3rd estimate of Q1 Gross Domestic Product (GDP) has economic activity expanding at a seasonally adjusted annualized rate (SAAR) of paltry 1.1%. This was up from the previous estimate of 0.8% growth reported a month ago and the 0.5% growth rate reported as the initial estimate two months ago. The latest data from the Bureau of Economic Analysis reflected higher than previously believed levels of exports and nonresidential fixed investment. As with the previous Q1 GDP reports, the positive contributors to economic growth were consumption, fixed residential investment, net exports, and government expenditures. The same report finds corporate profits grew for only the 2nd time in the past 6 quarters—profits from current production increased $34.7 billion or 1.8%. On July 29, we will get our first estimate of Q2 GDP
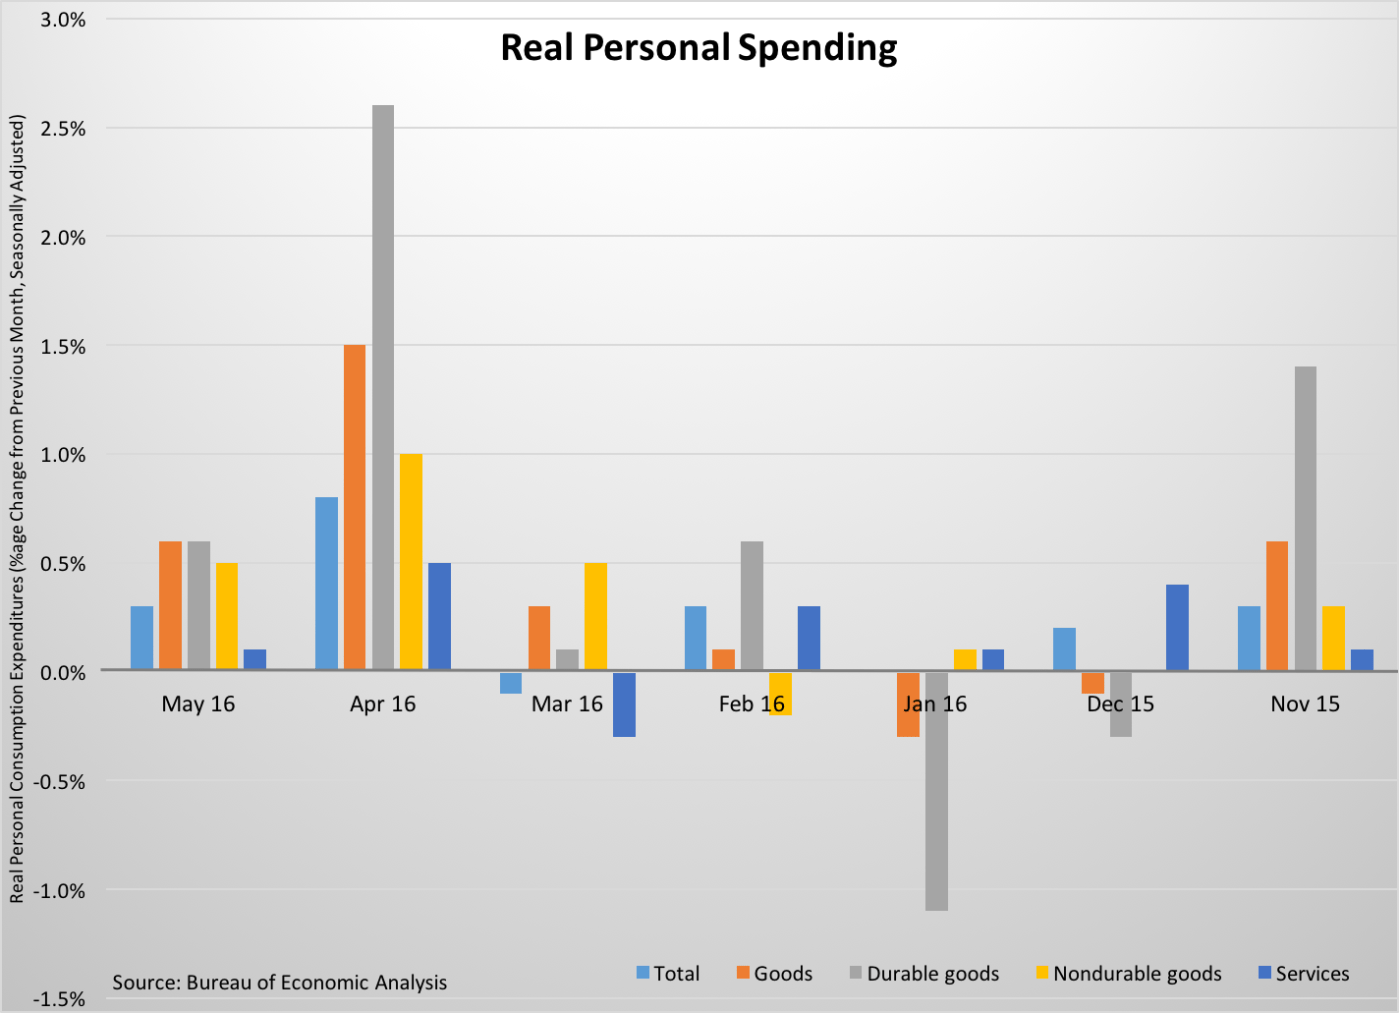
 Consumer spending grew for 2nd straight month in May. The Bureau of Economic Analysis finds “real” personal consumption expenditures (PCE) increased 0.3% during the month, following April’s 0.8% surge in spending. Real spending, which is adjusted for price variation, was up 2.7% from a year earlier. Real spending on goods increased 0.6%, with gains in durable and nondurable goods spending of 0.6% and 0.5%, respectively. Spending on services grew a more modest 0.1%. Without price adjustments, “nominal” PCE grew 0.4% during the month. A 0.2% gain in “nominal” personal income, wages, and disposable income funded the increase in spending. “Real” disposable income inched up 0.1%, putting it 3.2% above year ago levels. Meanwhile, the savings rate slipped 1/10th of a point to +5.3%.
 Purchasing managers report late spring gains in manufacturing activity. The Purchasing Managers’ Index from the Institute for Supply Management added 1.9 points during June to a seasonally adjusted 53.2. This was the PMI’s 4th straight month above a reading of 50.0, indicative of an expanding manufacturing sector. All 5 components of the PMI improved from their May readings: new orders (+2.3 points to 57.0), production (+2.1 points to 54.7), employment (+1.2 points to 50.4), supplier deliveries (+1.3 points to 55.4), and inventories (+3.5 points to 48.5). 13 of 18 tracked manufacturing sectors expanded during the month, led by printing, textile mills, petroleum/coal, and food/beverage/tobacco.
ISM also released the results from a supplement survey of purchasing managers conducted following the British voters’ decision to withdraw from the European Union. More than 3 in 5 procurement managers said that the Brexit vote would have a “negligible impact” on their business while a third were expecting a negative impact. But even that may overstate their level of concern as the vast majority of survey respondent anticipating detrimental effects only expect a “slightly negative impact.” Purchasing managers see the most likely significant impact from Brexit being have to adjust to changes in the exchange value of the U.S. dollar, followed by changes in global demand and changes in demand from U.K. customers.
 Construction spending slowed for a 2nd straight month. The Census Bureau reports that the seasonally adjusted annualized value of construction put into place during May was $1.143 trillion, off 0.8% from April and up only 2.8% from a year earlier. Private construction spending slipped 0.3% during the month to $850.3 billion (+4.7% vs. May 2015). Private sector residential spending was flat for the month, with a 1.3% drop in construction spending for new single-family units and a 1.8% bump up in spending for multi-family units. Nonresidential construction spending contracted 0.7%, pulled down by reduced spending on religious, educational, manufacturing, and commercial construction. Public sector spending dropped 2.3% during the month to $284.0 billion (-2.6% vs. May 2015).
 A measure of consumer sentiment bounces up during June. Contrasting with the results from the University of Michigan’s sentiment survey reported here last week, the Conference Board’s Consumer Confidence Index gained 5.6 points during June to a seasonally adjusted 98.0 (1985 = 100). This was the index’s best reading since last September. Measures for both present and expected conditions improved during the month: the former added 5.1 points to 118.3 while the latter gained 6.0 points to a reading of 84.5. 26.9% of survey respondents described current economic conditions as “good” while only 17.7% said that they were “bad.” They were less sanguine about the labor market as nearly equal percentages of Americans saw the number of jobs as being “plentiful” (23.4%) and “hard to get” (23.3%). The press release noted that “consumers remain cautiously optimistic about economic growth in the short-term.”
Other data released over the past week that you might find of interest:
– Jobless Claims (week ending June 25, 2016, First-Time Claims, seasonally adjusted): 268,000 (+10,000 vs. previous week; -12,000 vs. the same week a year earlier). 4-week moving average: 267,000 (-3.0% vs. the same week a year earlier).
– Vehicle Sales (June 2016, seasonally adjusted annualized rate): 16.66 million vehicles (-4.5% vs. May 2016, -2.0% vs. June 2015).
– Pending Home Sales (May 2016, Index (2001 = 100), seasonally adjusted: 110.8 (-3.7% vs. April 2016, -0.2% vs. May 2015).
– Case-Shiller Home Price Index (April 2016, 20-City Index, seasonally adjusted): +0.5% vs. March 2016, +5.4% vs. April 2015.
The opinions expressed here are not necessarily those of Kevin’s current and previous employers. No endorsements are implied.
