
Payrolls and service sector activity both rebounded in June after showing weakness during May. Here are the 5 things we learned from U.S. economic data released during the week ending July 8.
 June was the best month for job creation since last October. The Bureau of Labor Statistics estimates nonfarm employers added a seasonally adjusted 287,000 workers during the month. This was a sharp improvement from the measly 11,000 job gain during May (which reflected a downward revision from its original estimate of 38,000 added jobs). The private sector expanded payrolls by 265,000 workers, with the vast majority of the gain in the service sector (+256,000). Industries with the largest job adds were leisure/hospitality (+59,000), health care/social assistance (+58,400), information (+44,000, which includes the impact of Verizon strikers returning to work), professional/business services (+38,000), and retail (+29,900). The same report kept the average number of hours worked at 34.4 hours for the month (off 1/10th of an hour from a year earlier) with average weekly earnings at $880.98 (+2.3% vs. June 2015).

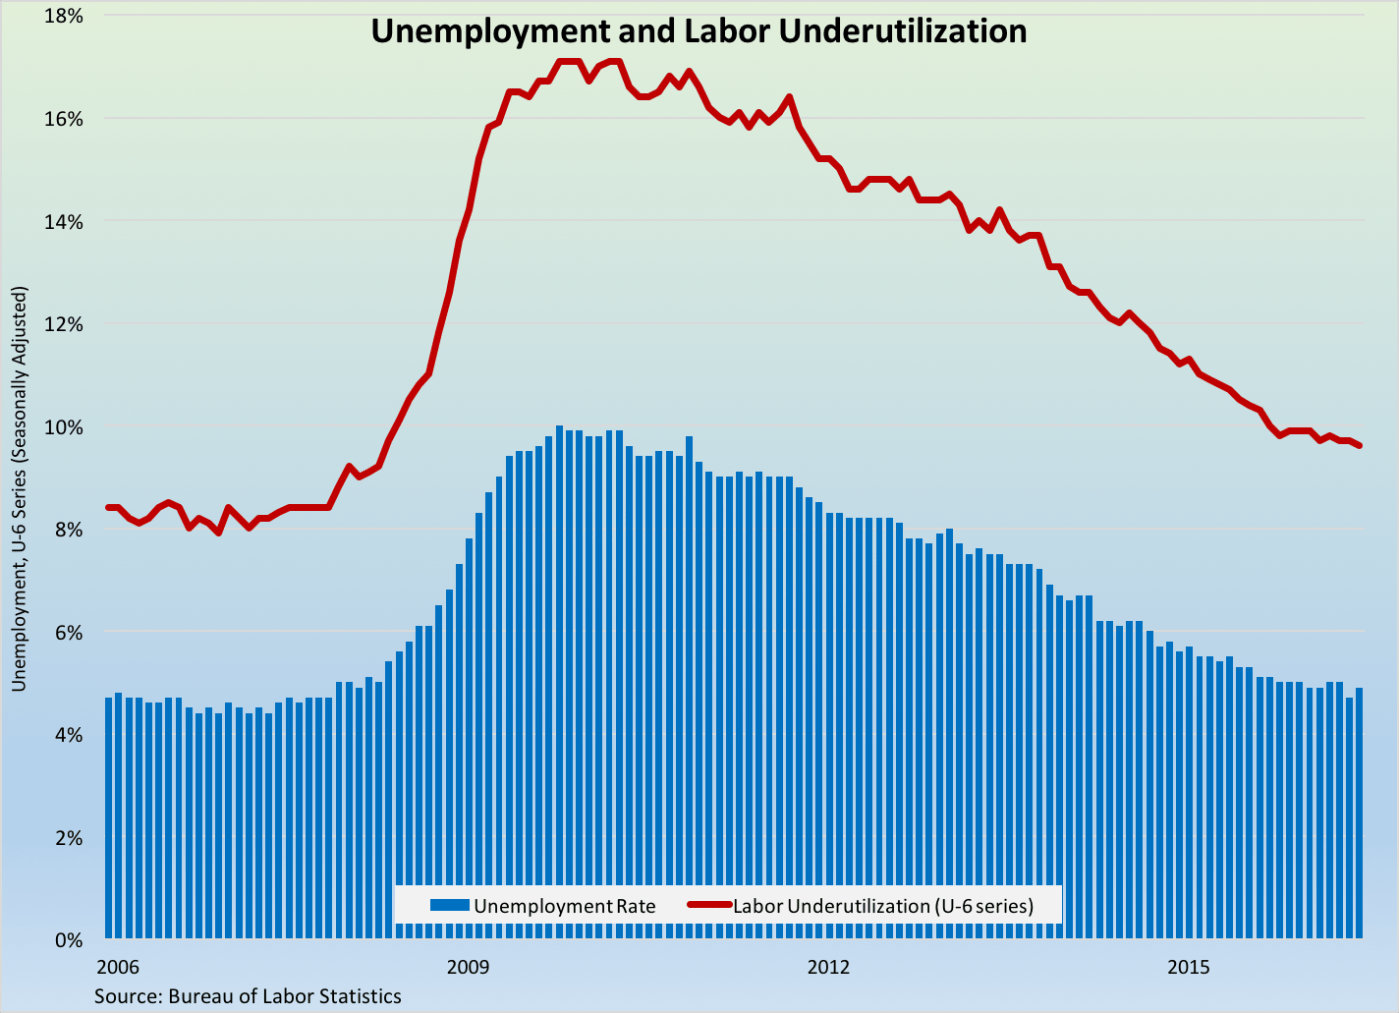
A separate survey of households has the seasonally adjusted unemployment rate being at 4.9%, up 2/10ths of a point from May but still off 4/10ths of a point from a year earlier. The unemployment rate increased in part because this survey found a far weaker pace of job creation compared to the establishment survey data reported above (+67,000) and because 414,000 entered the labor force during the month. The labor force participation rate inched up 1/10th of a percentage point to 62.7%, which stays nevertheless near its multi-decade low. The same survey finds a number of new post-recession lows: the count of “involuntary” part-time works fell to 5.843 million, the median length of unemployment dropped to 10.3 weeks, and the broadest measure of labor underutilization inched down to 9.6%.
 Higher imports resulted in a larger trade deficit for a 2nd straight month during May. The Census Bureau/Bureau of Economic Analysis have export activity slowing by $0.3 billion to $182.4 billion (-4.2% vs May 2015) while imports grew by $3.4 billion to $223.5 billion (-3.1% vs. May 2015). The resulting trade deficit expanded by $3.7 billion to -$41.1 billion. This was the widest trade deficit since February, putting it 2.4% larger than the deficit from a year earlier. The goods deficit expanded by $3.6 billion to -$62.2 billion while the services surplus slipped by $0.1 billion to +$21.1 billion. The former expanded because of declining exports for civilian aircraft, computer accessories, and automotive vehicles/parts, along with increased imports of nonmonetary gold, crude oil, consumer goods, and civilian aircraft. Adjusted for inflation using 2009 chained dollars, the “real” goods deficit grew by $3.6 billion to -$61.1 billion as exports decreased by $1.8 billion and imports increased by $1.8 billion. The U.S. had its largest goods deficits with China, the European Union, Germany, Mexico, and Japan.
 Fewer orders for military planes pulled down factory orders during May. The Census Bureau places its estimate of new orders for manufactured goods at a seasonally adjusted $455.2 billion, down 1.0% from April and 1.2% below its year ago pace. The report included a small downgrade from the prior week’s estimate of durable goods orders as this report shows a 2.3% drop (vs. a 2.2% decline reported a week earlier). Transportation goods orders slumped 5.7%, with sharp declines for defense aircraft (-35.3%) and ships/boats (-20.6%). New orders for motor vehicles gained 0.8%. Other major durable goods product lines experiencing declining orders were primary metals (-1.8%), electrical equipment/appliances (-0.6%), fabricated metal products (-0.3%), and furniture (-0.1%). Meanwhile, nondurables orders gained 0.3% during the month. Shipments increased for a 3rd straight month with a less than 0.1% improvement to $456.5 billion (-3.2% vs. May 2015). Unfilled orders grew for the 4th time in 5 months (+0.2%) while inventories contracted for the 12th time in 13 months (- 0.1%).
 The service sector rebounded in June. The headline index from the Institute for Supply Management’s Non-Manufacturing Report on Business added 3.6 points during June to a seasonally adjusted 56.5, putting the measure at its highest point since last November. The index has been above the expansion/contraction threshold of 50.0 for 77 straight months. All 4 index components improved from their May marks: new orders (+5.7 points to 59.9), business activity (+4.4 points to 59.5), employment (+3.0 points to 52.7), and supplier deliveries (+1.5 points to 54.0). 15 of 18 tracked service sector industries grew during the month; including, mining, arts/entertainment/recreation, and management of companies. The press release characterizes the results as being a “strong rebound” from May’s survey figures that it says reflected a one-month “cooling off.”
 Consumer credit balances expanded again in May, but credit cards were not a major source of the increase. The Federal Reserve reports that outstanding consumer credit balances (net of all real estate-backed loans, including mortgages) were at a seasonally adjusted $3.624 trillion at the end of May, up $18.6 billion from April and 6.3% from a year earlier. The latter represented the smallest 12-month gain in consumer credit balances since March 2013. Revolving credit card balances expanded by only $2.4 billion to $953.3 billion (+5.4% vs. May 2015). Nonrevolving credit balances (e.g., auto loans, college loans) grew by $16.2 billion to $2.670 trillion (+6.6% vs. May 2015).
Other data released over the past week that you might find of interest:
– Jobless Claims (week ending July 2, 2016, First-Time Claims, seasonally adjusted): 254,000 (-16,000 vs. previous week; -37,000 vs. the same week a year earlier). 4-week moving average: 264,750 (-4.9% vs. the same week a year earlier).
– FOMC meeting minutes
The opinions expressed here are not necessarily those of Kevin’s current and previous employers. No endorsements are implied.
