
As the world considers the economic and political implications of the Brexit vote, we learned last week that U.S. economic activity lagged during the spring. Here are the 5 things we learned from U.S. economic data released during the week ending June 24.
 Two indicators of economic activity show soft business conditions this spring. The Chicago Fed National Activity Index (CFNAI), a monthly index based on 85 economic indicators that tracks overall economic activity, dropped 56-basis points during May to a reading of -0.51. While all 4 major categories of index components deteriorated from their April readings, the bulk of decline was associated with production/income-related economic indicators.
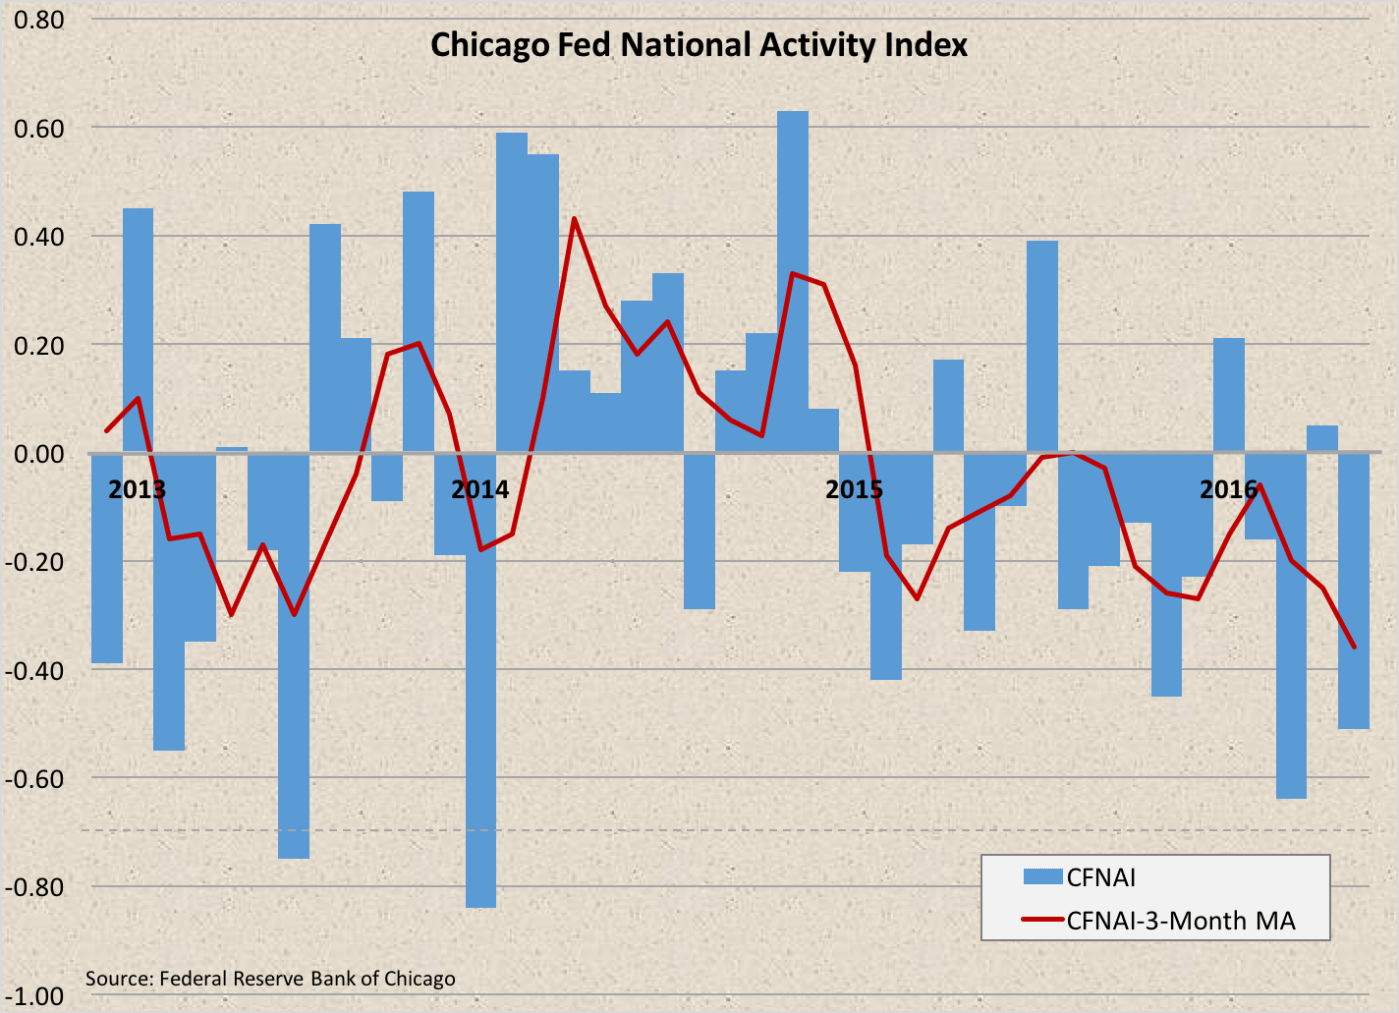
  These measures made a negative contribution to the CFNAI of 32-basis points (a 45-basis point drop from their April contribution of +0.13). The other 3 major categories of index components also losing stream during May were: consumption/housing (off 7-basis points to -0.09), employment (off 3-basis points to -0.09) and sales/orders (off a basis point to -0.01). The CFNAI’s 3-month moving average shed 11-basis points to -0.36. This was the moving average’s lowest reading in nearly 4 years. Nevertheless, the reading is not indicative of an U.S. economy that was in a recession since it remained above -0.70. Rather, the moving average reading of -0.36 is consistent with below average economic growth.
The Conference Board’s Leading Economic Index lost 2/10ths of a point during May to a reading of 123.7. The index was unchanged from 6 months earlier and was up by only 1.2% from a year earlier. 6 of 10 components made a positive contribution to May’s leading index reading, including the interest rate spread, factory orders for nondefense/non aircraft capital goods, and building permits. The main drag was a bump up in 1st time unemployment insurance claims. The coincident index was unchanged for the month and was up 1.9% from a year earlier. 3 of the coincident index’s 4 components improved during May. The lagging index added 3/10ths of a point during the month to 121.5 (+3.8% vs. May 2015), as 5 of 7 index components enjoyed gains. The press release said the index readings suggest “moderate” economic growth over the coming months but warns that “volatility in financial markets and a moderating outlook in labor markets could pose downside risks to growth.”
 Sales of previously owned homes inched ahead to a post-recession high during May. Existing home sales were a seasonally adjusted annualized rate of 5.53 million units during the month, up 1.8% from April, up 4.5% from a year earlier, and the fastest sales pace since February 2007. According to the National Association of Realtors, sales of previously owned homes improved in 3 of 4 Census regions during the month: West (+5.4%), South (+4.6%), and Northeast (+4.1%). Sales slowed 6.5% in the Midwest. There were 2.15 million homes available for sale at the end of May, up 1.4% from April but off 5.7% from May 2015. The resulting tight 4.7 month supply led to a 4.7% year-to-year increase in the median sales price of previously owned homes to $239,700. While warning that first-time homebuyers were “still struggling to enter the market,” NAR’s press release did predict that home sales “have the potential to mostly maintain their current pace through the summer.”
 Even with a drop in May, new home sales also remained their near post-recession highs. The Census Bureau reports that new home sales were at a seasonally adjusted annualized rate of 551,000 units. Despite being down 6.0% for the month, new home sales were 8.7% above their year ago pace. Sales slowed in 3 of 4 regions—the Northeast, West, and South—but improved in the Midwest. 3 of 4 Census regions—the Northeast, Midwest, and South had positive year-to-year sales gains. Homebuilders had 244,000 homes on the market at the end of May (+1.2% vs. April 2016, +16.2% vs. May 2015), the equivalent to a 5.3 month supply.
 Durable goods orders stumbled in May following 2 monthly gains. The Census Bureau estimates the value of new orders for durable manufactured goods declined 2.2% to a seasonally adjusted $230.7 billion (+1.5% vs. May 2015). Transportation goods orders fell 5.6% during the month as orders for vehicles (-2.8%) and defense aircraft (-34.1%) both slowed. Civilian aircraft orders grew 1.0% in May following the previous month’s 69.4% surge. Orders for non-transportation durable goods declined 0.3% during the month following gains of 0.3% and 0.5% during the 2 previous months. While orders for communications equipment jumped 4.7%, orders dropped for computers (-2.5%), primary metals (-1.4%), and fabricated metals (-0.3%). Shipments declined for the 3rd time over the past 4 months with a 0.2% drop. Non-transportation goods shipments slowed 0.3%. The value of unfilled orders expanded for the 4th time in 5 months with a 0.2% increase while inventories of durable goods contracted for the 10th time in the past 11 months with a 0.3% decline.
 One survey finds consumers are slightly less optimistic about economic conditions. The University of Michigan Index of Consumer Sentiment came in at a seasonally adjusted reading of 93.5 for June, off 8/10ths of a point from the preliminary June reading released a few week ago, 1.2 points from May, and 2.6 point from a year earlier. The drop from May was the result of a weaker outlook for future economic business conditions, with an index reading 82.4 being off 2.5 points from May and 5.4 points from a year earlier. The present conditions index edged up 9/10ths of a point during the month to 110.8 (+1.9 points vs. June 2015). The press release stated that consumers do not anticipate a recession but they “increasingly expect a slower pace of growth in the year ahead.” Further, the results are consistent with GDP growth of less than 2.0% and real consumer spending increased 2.6% for all of 2016.
Other data released over the past week that you might find of interest:
– Jobless Claims (week ending June 18, 2016, First-Time Claims, seasonally adjusted): 259,000 (-18,000 vs. previous week; -13,000 vs. the same week a year earlier). 4-week moving average: 267,000 (-2.6% vs. the same week a year earlier).
– FHFA House Price Index (April 2016, Purchase-Only Index, seasonally adjusted): +0.2% vs. March 2016, +5.9% vs. April 2015.
The opinions expressed here are not necessarily those of Kevin’s current and previous employers. No endorsements are implied.
