
Like they have for every month over the past 5.5 years, employers expanded their payrolls. Here are the 5 things we learned from U.S. economic data released during the week ending April 1.
 Employers continued adding workers to their payrolls in March. The Bureau of Labor Statistics estimates nonfarm payrolls grew by a seasonally adjusted 215,000, which makes it an impressive 66 straight months of employment gains. The BLS revised its previously reported job gains for January and February by -4,000 and +3,000, respectively. Private sector employers added 195,000 jobs during March and has expanded employment by 2.681 million workers over the past 12 months. Private service sector employers added 199,000 jobs, with retail, health/social assistance, leisure/hospitality and professional/business services leading the way. The goods-producing side of the economy lost 4,000 workers as gains in the construction industry were outweighed by job losses in both manufacturing and mining. Overall, more private sector industries created jobs versus that of a year earlier with a private sector diffusion index reading of 58.4 in March versus 55.0 a year earlier. The average workweek was at 34.4 hours (March 2015: 34.5 hours) while average weekly earnings have grown a modest 2.0% over the past year to $874.79.
 Based on a separate survey of households, the unemployment rate edged up 1/10th of a
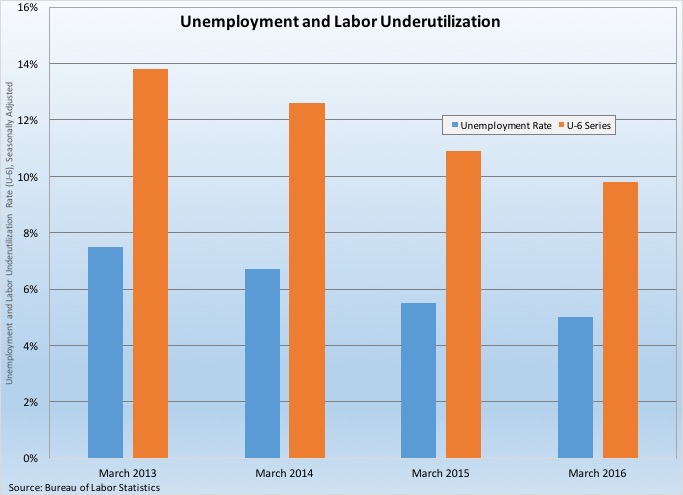
percentage point to 5.0%. This was in part due to 396,000 people entering the labor force during the month. In just the past 3 months, 1.453 million people have entered the labor force. The labor force participation rate inched up by another tenth of a percentage point to 63.0%, its highest point in 2 years but still a good 3 full percentage points below pre-recession levels. 6.123 million people held part-time jobs but were seeking a full-time position, up 135,000 from February but 8.2% below year ago levels. The median length of unemployment of 11.4 weeks was up 2/10ths of a week from February but off 7/10ths of a week from March 2015. Finally, the U-6 series, the broadest measure of labor underutilization from the BLS, inched up 1/10th of a percentage point to 9.8%. The same measure was at 10.9% a year ago and at 17.1% when at its recession peak back in the spring of 2010.
 Real consumer spending increased modestly in February. According to the Bureau of Economic Analysis, consumer spending was at a seasonally adjusted annualized rate of $11.378 trillion (based on chained 2009 dollars). This was up 0.2% from January and +2.8% from a year earlier. This was the best year-to-year comparable reported since last October. Spending on goods slipped 0.1% (its 4th drop in 5 months) while that for services gained 0.3% (its best since last September). Real durable goods spending gained 0.3%, including a 0.6% bump in spending for vehicles. Nondurables spending slowed 0.3%, pulled down by lower expenditures for clothing and groceries. Versus a year earlier, spending on goods had grown 3.3% (durable goods: +5.2%) while that for services had increased 2.5%. Prices, as measured by the personal consumption expenditures (PCE) deflator slipped 0.1% during February and was up only 1.0% from a year earlier. Net of energy and food, the PCE deflator remained below the Federal Reserve’s 2% target rate with a 12-month comparable of +1.7%.
The same BEA report has both personal and disposable income growing 0.2% on a seasonally adjusted nominal basis during February with “real” disposable income gaining 0.3%. Real disposable income was 2.7% above year ago levels. The savings rating increased 1/10th of a percentage point to +5.4%, matching its March 2015 reading.
 Consumer sentiment solidified during March. The Conference Board Consumer Confidence Index rebounded in March with a 2.2 point gain to a seasonally adjusted reading of 96.2 (1985 = 100) following a 3.8 point drop during the previous month. The gain was the result of consumers’ improved forward looking outlook as the expectations index added 4.8 points to 84.7 (its best reading since last October). The current conditions index shed 1.5 points to 113.5 (its lowest point since last November). Just 12.9% of survey respondents anticipate an increase in the number of available jobs over the next 6 months while 17.2% expect their personal incomes will increase over the same time period. The press release said the results suggest that “consumers do not foresee the economy gaining any significant momentum in the near-term, nor do they see it worsening.”
While the Index of Consumer Sentiment from the University of Michigan lost 7/10ths of a point to 91.0, this represented a full point improvement from the preliminary March reading reported a few weeks earlier. March’s final reading was 2.0 points below its year ago level. The current conditions index lost 1.2 points to 105.6 while the expectations index declined 4/10ths of a point to 81.5. The survey results suggest that we will see a 2.7% gain in real consumer spending for all of 2016. The press release notes that consumers were not too concerned about their own personal financial situation even as they anticipate gasoline prices to continue increasing.
 Purchasing managers report growth in manufacturing activity for the 1st time since last summer. The Purchasing Managers’ Index (PMI) from the Institute for Supply Management added 2.3 points during March to a seasonally adjusted reading of 51.8. This was the first time since last August that the measure was above a reading of 50.0, indicative of an expanding manufacturing sector. 4 of 5 index components improved during the month, including new orders (up 6.9 points to 58.3), production (up 2.5 points to 55.3), inventories (up 2.0 points to 47.0) and supplier deliveries (up a ½ point to 50.2). The employment component lost 4/10ths of a point to 48.1, the 5th time over the past 6 months in which the measure was below a reading of 50.0. 12 of 18 tracked manufacturing sectors expanded during the month, with 13 industries reporting a gain in new orders.
 While declining in February, construction spending remains well above year ago levels. The Census Bureau reports the value of construction put in place fell 0.5% during the month to a seasonally adjusted annualized rate of $1.144 trillion. But even with the drop, construction spending was 10.3% above year ago levels. Private construction spending slipped 0.1% during the month to $846.2 billion (+10.6% vs. February 2015). Spending on residential construction gained 0.9%, including increases of 1.2% and 0.9% for spending on new single-family and new multi-family homes, respectively. Private nonresidential construction spending dropped 1.3%, with declines seen in the communication, manufacturing, religious, transportation, power and commercial sectors. Public sector construction spending was at an annualized rate of $297.8 billion, down 1.7% for the month but still 9.2% above year ago levels.
Other data released over the past week that you might find of interest:
– Jobless Claims (week ending March 26, 2016, First-Time Claims, seasonally adjusted): 276,000 (+11,000 vs. previous week; +8,000 vs. the same week a year earlier). 4-week moving average: 263,250 (-6.7% vs. the same week a year earlier).
– Vehicle Sales (March 2016, seasonally adjusted annualized rate): 16.57 million (-5.5% vs. February 2016; -3.3% vs. March 2015).
– Pending Home Sales (February 2016, Index (2001 = 100), seasonally adjusted): 109.1 (+3.5% vs. January 2016, +0.7% vs. February 2015).
– Case-Shiller Home Price Index (January 2016, 20-City Index, seasonally adjusted): +0.8% vs. December 2015, +5.7% vs. January 2015.
The opinions expressed here are not necessarily those of Kevin’s current and previous employers. No endorsements are implied.
