
The labor market remains a bright spot as hiring jumped to a post-recession high during February. Meanwhile, global demand for U.S. goods weighed on the trade deficit. Here are the 5 things we learned from U.S. economic data released during the week ending April 8.
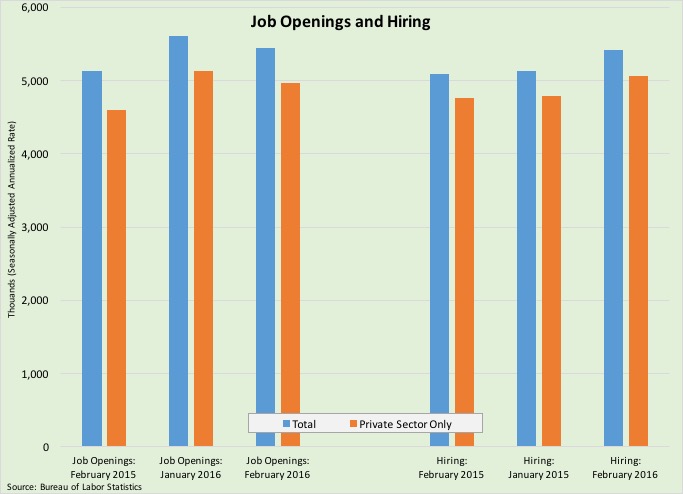
 The count of job openings slipped but the pace of hiring surged in February. The Bureau of Labor Statistics says there were a seasonally adjusted 5.445 million jobs available at the end of February, down 159,000 from January but still 6.1% above the February 2015 count. Industries with the largest year-to-year percentage gains in job openings were construction (+27.0%), retail (+14.5%), professional /business services (+14.1%) and education/health care (+8.3%). Meanwhile, there were a seasonally adjusted 5.422 million people hired during the month, up 297,000 from January, a 6.5% gain from a year earlier and its fastest pace since the fall of 2006. The largest year-to-year percentage gains in hiring occurred in retail (+18.6%), trade/transportation/utilities (+12.1%) and leisure/hospitality (+11.1%). Hiring outpaced departures. A seasonally adjusted 5.050 million people left their jobs during the month, up 73,000 from January and 6.5% from a year earlier.
  Another positive labor market trend is that more people voluntarily left their jobs (presumably because either they had another job or were optimistic about their job prospects). Voluntary quits have grown 9.1% over the past year to 2.95 million. Meanwhile, layoffs held virtually unchanged during the month at 1.715 million. This was up 1.9% from a year earlier.
 Weak global demand for U.S. goods continued to weigh on the trade deficit. The Census Bureau and Bureau of Economic Analysis reports that the U.S. trade balance for February was at -$47.1 billion, up $1.2 billion from January. While exports increased by $1.8 billion during the month to $178.1 billion, this was still the 2nd lowest reading since June 2011 and it was down 4.2% from a year earlier. February’s growth in exports was sparked by a $1.1 billion gain in consumer goods (particularly for gem diamonds and pharmaceutical preparations) while the gain in imports was led by increased exports for consumer goods (particularly for pharmaceutical preparations and toys/games/sporting goods) and automobiles. The goods deficit widened by $0.8 billion to -$64.7 billion (February 2015: -$58.1 billion) while the services surplus contracted by $0.3 billion to +$17.7 billion (February 2015: +$19.5 billion). Based on 2009 chained dollars, the “real” goods deficit expanded by $1.6 billion to -$63.3 billion (February 2015: $52.3 billion).
 As we saw with the previous week’s durable goods orders report, new factory orders slumped during February. The Census Bureau reports new orders for manufactured goods fell for the 3rd time in 4 months with a 1.7% drop to a seasonally adjusted $454.0 billion (-3.0% vs. February 2015). Durable goods fell 3.0% during the month while those for nondurable goods slowed 0.4%. Declining during the month were orders for transportation goods (-6.2%, including declines of 27.2% and 28.0% for civilian and defense aircraft, respectively), electrical equipment/appliances (-3.6%), machinery (-3.4%), computer/electronics (-1.7%) and fabricated metal products (-1.0%). Nondefense capital goods excluding aircraft—a proxy for business investment—declined 2.5% during the month while new orders for consumer goods slumped 0.7%. Shipments fell for the 10th time in 11 months with a 0.7% decline, unfilled orders decreased for the 2nd time in 3 months with a 0.3% decline and inventories contracted for a 8th straight month with a 0.4% drop.
 Service sector activity expanded at a faster pace during March. The headline index from the Institute for Supply Management’s Report on Business—Nonmanufacturing added 1.1 points to a seasonally adjusted 54.5. This was the measure’s 1st gain following 4 straight monthly declines and was the 74th consecutive month above a reading a 50.0, the threshold between a growing and contracting service sector. All 4 index components improved during the month and were above a reading of 50.0: business activity (59.8), new orders (56.7), supplier deliveries (51.0) and employment (50.3). 12 of 18 service sector industry segments expanded during the month, led by education, information and wholesale trade. The press release noted that survey participants had indicated “that business conditions are mostly positive and that the economy is stable and will continue on a course of slow, steady growth.”
 Wholesalers continued to shed inventory during February. The Census Bureau estimates merchant wholesalers held $583.3 billion in inventories at the end of February, down 0.5% for the month and just 0.6% above year ago levels. Smaller inventories of lumber/construction goods (-1.6%) helped pull down overall durable goods inventories 0.1%. Drops in holdings of farm product raw materials and drugs/druggists’ sundries led to a 1.1% contraction in nondurable goods inventories. Wholesale sales declined 0.2% during February to a seasonally adjusted $427.6 billion (-3.1% vs. February 2015). As a result, the inventory-to-sales ratio slipped a basis point to 1.36. The same measure was at 1.31 a year ago.
Other data released over the past week that you might find of interest:
– Jobless Claims (week ending April 2, 2016, First-Time Claims, seasonally adjusted): 267,000 (-9,000 vs. previous week; -13,000 vs. the same week a year earlier). 4-week moving average: 263,250 (-4.7% vs. the same week a year earlier).
– Consumer Credit (February 2016, Outstanding non-real estate consumer debt, seasonally adjusted): $3.568 trillion (+$17.2 billion vs. January 2016, +6.6% vs. February 2015).
– FOMC meeting minutes
The opinions expressed here are not necessarily those of Kevin’s current and previous employers. No endorsements are implied.
