
On one hand, a revised Q3 GDP estimate does not inspire nor does data on November business conditions. Yet, consumer sentiment improved as 2015 was wrapping up with Americans opening up their wallets. Here are the 5 things we learned from U.S. economic data released during the week ending December 25.
 Final results are in: Q3 economic growth was restrained, hurt by tepid exports and a drag from inventories. The Bureau of Economic Analysis released its third estimate of third quarter Gross Domestic Product (GDP) and it barely changed from the 2nd estimate released a month earlier. GDP grew at a 2.0% seasonally adjusted annualized rate (SAAR) between the months of July and September, just off from the 2.1% gain reported a month earlier. As we saw previously, the biggest positive contributors to economic growth were consumption (adding 204-basis points to GDP growth), fixed nonresidential investment (+33 basis points), government expenditures (+32-basis points) and fixed residential investment (+27-basis points). Dragging on Q3 GDP growth were the change in private inventories (costing 72-basis points in GDP growth) and net exports (-26-basis points). Corporate profits (after adjustments for inventory valuation and capital consumption) fell 1.6% during the quarter to a SAAR of $2.050 trillion (-5.1% vs. Q3 2014).
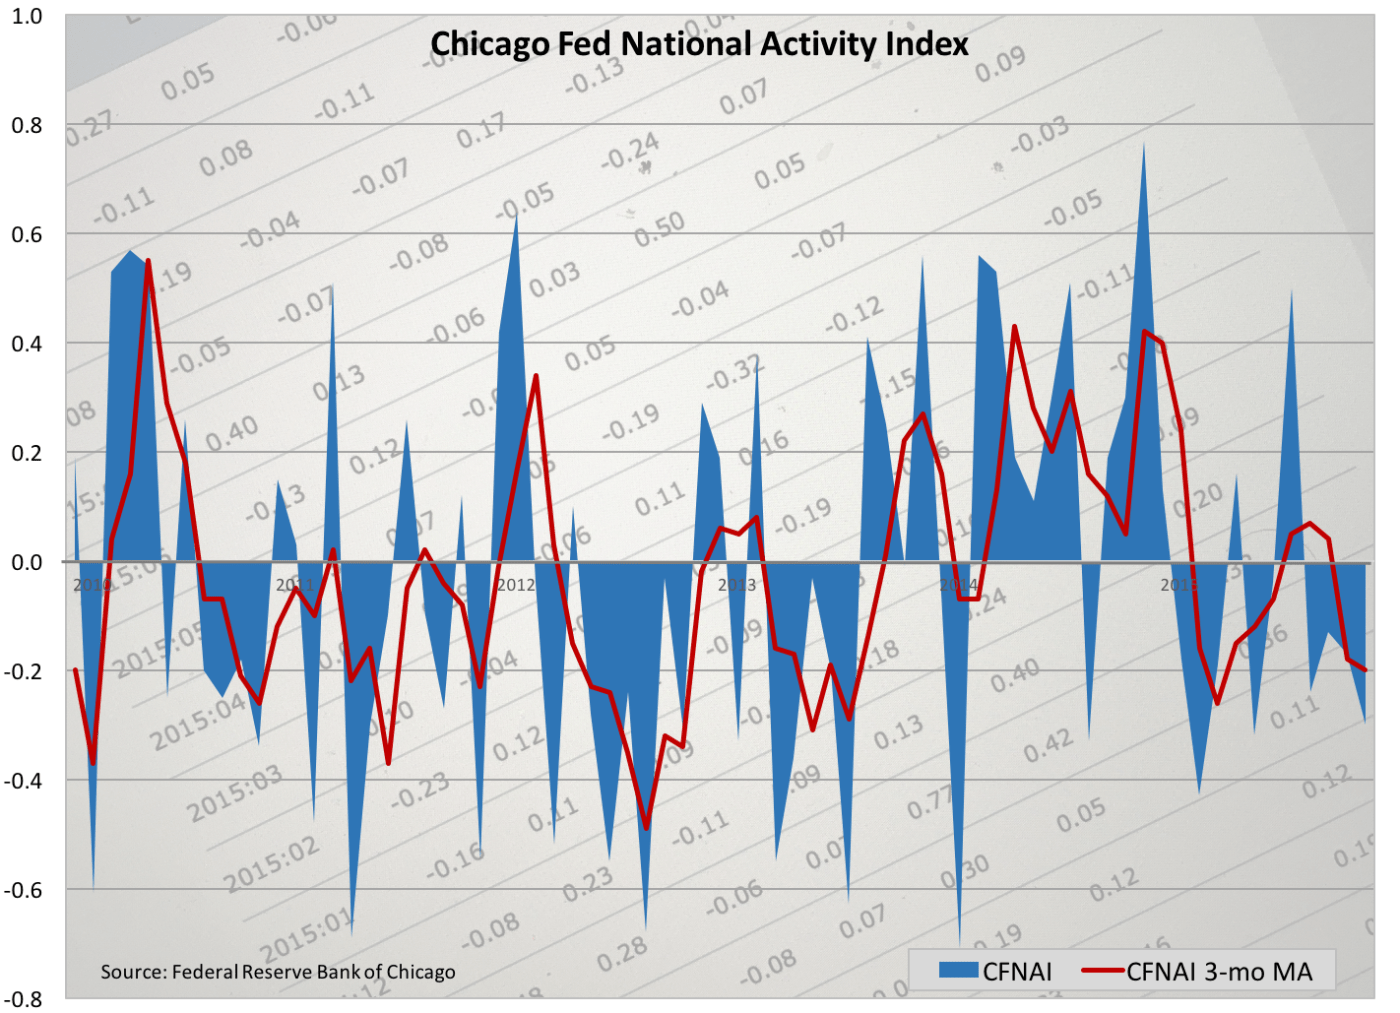
 Economic activity sputtered in November. The Chicago Fed National Activity Index (CFNAI), a weighted average of 85 economic indicators produced by the Federal Reserve Bank of Chicago, shed 13-basis points to a reading of -0.30. This was the measure’s lowest reading since May and the 6th time over the past 7 months in which it was below a reading of zero, indicative of below average economic growth. Most of November’s decline can be tied to a 16-point drop with economic indicators associated with production & income.
  Improving slightly during the month were indicators tied to consumption/housing, employment and sales/orders/inventories. The 3-month moving average for the CFNAI lost 2-basis points during the month to a reading of -0.20, it lowest point since March. Nevertheless, the moving average stayed above a reading of -0.70, indicating soft economic growth in the U.S. during the fall.
 Consumers were spending more money in November. The Bureau of Economic Analysis estimates “real” personal consumption expenditures (PCE) picked up 0.3% during the month to a seasonally adjusted annualized rate of $11.323 billion (in 2009 “chained” dollars). This was the measure’s biggest increase in 3 months, yet spending up a relatively modest 2.5% from the same time a year earlier. While spending on services was flat from October, spending on goods increased 1.0%, with nearly equal gains for durables (+1.1%) and nondurables (+0.9%). Sales gains were spread out across most major categories of durable and nondurable goods. Nominal (i.e., not adjusted for inflation) spending also grew 0.3% during the month. The increased spending was funded by a 0.3% gain in nominal personal income (+4.4% vs. November 2014). Disposable income also grew 0.3% during the month, with a 0.2% increase after adjusting for inflation. The savings rate inched down 1/10th of a percentage point to +5.5% (November 2014: +4.6%).
 A measure of consumer sentiment ended the year at a 5-month high. The Index of Consumer Sentiment from the University of Michigan added 1.3 points during December to a seasonally adjusted 92.6 (1966 Q1 = 100). This was an 8/10ths of a point improvement from the preliminary December reading reported a few weeks ago. All of December’s gain came from the present conditions index, which zoomed up 3.8 points to 108.1 (its best reading since June). The expectations index inched down 2/10ths of a point to 82.7. The press release attributes December’s increase to “lower inflation, which bolstered real income and brightened buying plans for household durables.” The group also said that the survey results also suggest a 2.8% increase in “real” consumer spending in 2016.
 Paperwork slowdowns weighed on existing home sales during November, while new home sales perked up. The National Association of Realtors reports that sales of previously owned homes slumped 10.5% during the month to a seasonally adjusted annualized rate of 4.76 million units, its lowest point in 19 months. NAR attributes much of the decline to the new “Know Before You Owe” disclosure rules, which the association says has significantly extended closing times. As a result, NAR seemed relatively confident that November’s drop was not a sign of a “sudden, withering demand.” Sales were down in all 4 Census regions, with declines spanning from -15.4% in the Midwest to -6.2% in the South. Sales also were 3.8% below year ago levels, with the Northeast being the sole region with a positive 12-month comparable (+1.5%). Inventories of unsold homes contracted 3.3% during the month to 2.040 million units (-1.9% vs. November 2014 levels), the equivalent to a tight 5.1-month supply.
Meanwhile, the Census Bureau’s measure of new home sales grew 4.3% to a seasonally adjusted 490,000 units (+9.1% vs. November 2014 levels). Note that while NAR’s existing home sales data series tracks closed transactions, the Census Bureau’s new home sales data series measures only contract signings (and not necessarily closed transactions.) As a result, the Know Before You Owe issues largely were not in play with the new home sales data series. Sales gained on both a month-to-month and year-to-year basis in the West and South, but fell in the Northeast and Midwest. There were 232,000 new homes for sale at the end of November, up 2.2% from October and 10.5% from the same month a year ago.
Other data released over the past week that you might find of interest:
– Jobless Claims (week ending December 19, 2015, seasonally adjusted): 267,000 (-5,000 vs. previous week; -13,000 vs. same week a year earlier). 4-week moving average: 272,500 (-5.5% vs. same week a year earlier).
– Durable Goods (November, New Orders, seasonally adjusted): $238.8 billion (unchanged vs. October, +1.2% vs. November 2014).
– FHFA House Price Index (October, seasonally adjusted): +0.5% vs. September, +6.1% vs. October 2014.
The opinions expressed here are not necessarily those of Kevin’s current and previous employers. No endorsements are implied.
