
Another consumer sentiment survey rebounding in December was the highlight in an otherwise quiet holiday week of economic data news. Here are the 5 things we learned from U.S. economic data released during the week ending January 1.
 Another survey finds improving consumer confidence as 2015 wrapped up. Mimicking what we saw last week with a University of Michigan survey, the Conference Board Consumer Confidence Index added 3.9 points during December to a seasonally adjusted 96.5 (1985 = 100). Unlike with the University of Michigan Survey (which hit a 6-month high), this survey’s gain only recaptured some of the 6.5 points that were shed back in November. The present conditions index added 4.3 points to 115.3 (its best since September) while the expectations index added 3.5 points to 83.9 (still below the 88.7 reading from October). 27.3% of survey respondents said that business conditions were “good” versus 19.8% that said that they were “bad.” Looking to the future, 12.9% expected the number of available jobs was going to increase over the next 6 months and 16.3% anticipate their incomes will gain. The press release states that “consumers are expecting little change in both business conditions and the labor market” in 2016. Of more immediate interest, the bump up in both sentiment surveys would seem to suggest that the recently completed holiday sales season was a good one. Some other anecdotal information released in recent days suggest the same, including that from MasterCard, while other sales trackers were less sanguine. We will learn more in the coming days and weeks.
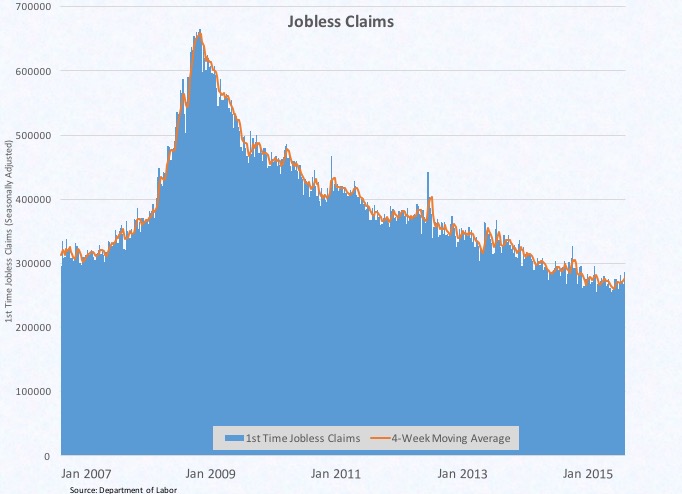
 Even with an increase in the days before Christmas, jobless claims remained at levels not seen in 15 years. The Department of Labor reports that the count of 1st time claims for unemployment insurance benefits jumped by 20,000 during the week ending December 26 to a seasonally adjusted 287,000. This was the measure’s largest 1-week gain since February, but it is worth noting that the data series can be particularly volatile during the holidays. The 4-week moving average increased by 4,500 to 277,000 claims.
  Even with its recent increases, the moving average in initial jobless claims remained 3.7% below year ago levels and has stayed under 280,000 every week since early May. The 4-week moving average of continuing jobless claims was at 2.220 million for the week ending December 19, down 7.5% from the same week a year earlier.
 Pending sales of previously owned homes slowed for the 3rd time in 4 months in November. The Pending Home Sales Index from the National Association of Realtors dropped a full point to a seasonally adjusted 106.9 (2001 = 100). Even with the recent declines, the index remained 2.7% above year ago levels. The index, which tracks signed contracts to purchase previously owned homes, gained during the month in the South (+1.3%) and Midwest (+1.0%) but contracted in the West (-5.5%) and Northeast (-3.0%). The Pending Home Sales Index was above their year ago readings in all 4 Census regions. NAR’s press release offered a number of reasons for the recent softness in contract signings; including, rising home prices, tight inventories and “mixed signs of an economy losing momentum.”
 Home prices jumped on a seasonally adjusted basis during October. The 20-city S&P Case-Shiller Home Price Index came in at 182.83, up 0.1% from September on a nominal basis that translates into a 0.8% surge after adjusting for typical seasonal variation. The 20-city index was 5.5% above year ago levels, yet remained 11.5% below the data series’ July 2006 peak. The index gained in 10 of the 20-tracked markets—led by Tampa (+0.7%), San Francisco (+0.6%), Phoenix (+0.5%) and Portland (+0.5%)—and was up in all 20 markets after taking typical seasonal variations into account. 3 markets have seen prices grow by more than 10% over the past year: Denver (+10.9%), Portland (+10.9%) and San Francisco (+10.9%). The press release notes that “generally good economic conditions continue to support gains in home prices.” Further, it says that future home buyers have little reason to “fear runaway mortgage interest rates” even as the Federal Reserve begins to bump up the fed funds target rate.
 Higher prices for fruit, vegetables and dairy goods in November led to only the 2nd gain in agricultural prices over the 6 months. The Department of Agriculture’s index for prices received by farmers increased by 3 points to 95 (100 = 2011). This was down 5.4% from the same month a year earlier. Crop prices gained 2.5% during the month as a 24.5% surge in commercial vegetable prices and a 5.3% jump in fruit prices outweighed the 3.2% drop in the prices for feed gains & hay. Pushing up vegetable prices were big gains for lettuce while strawberries and grapes led the jump in fruit prices. Prices for livestock and related products increased 1.0% during November with a 3.4% increase in dairy product prices and a 4.6% drop in the prices for meat animals.
The opinions expressed here are not necessarily those of Kevin’s current and previous employers. No endorsements are implied.
