
: What We Learned During the Week of August 24-28")
Extreme stock market volatility overshadowed the stream of largely positive U.S. economic news released last week. Here are the 5 things we learned from U.S. economic data released during the week ending August 28.
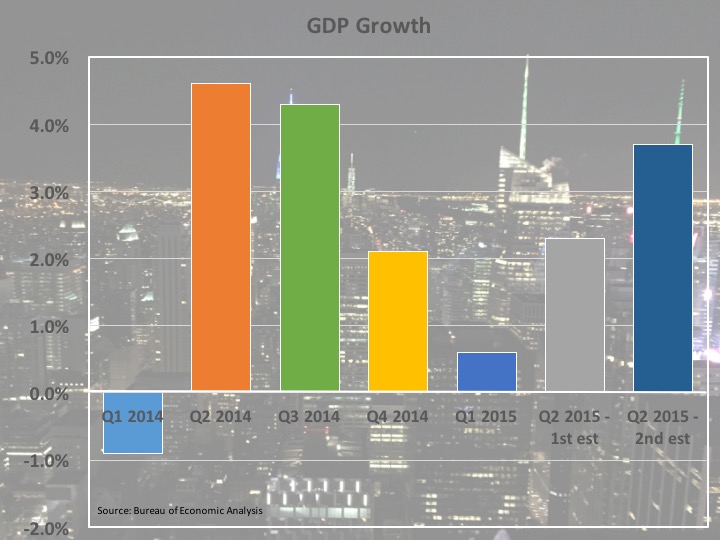
 Q2 was a better much quarter for economic growth than previously believed. The Bureau of Economic Analysis sharply revised upward its estimate of seasonally adjusted annualized growth in the Gross Domestic Product (GDP) from +2.3% to +3.7%. This follows the +0.6% SAAR economic expansion during the first 3 month of the year. The upward revision was the result of improved results for nonresidential fixed investment, private inventory investment, state & local government spending and consumption, along with a downward revision to imports. The same report featured the first estimate of Q2 corporate profits—profits from current production (which is corporate profits with inventory valuation and capital consumption adjustments) increased 2.4%, its first gain after 2 consecutive quarterly declines. The BEA will revise its estimate of Q2 GDP once again at the end September.
 Personal spending grew modestly in July, thanks to strong car sales. The BEA estimates “real” consumer spending grew 0.2% during July, following no change in June and a 0.5% increase during May. Real spending on durable goods jumped 1.3%, boosted by a 2.6% gain in spending for motor vehicles, while spending on both nondurables and for services each edged up 0.1%. Over the past year, real consumer spending has grown 3.2%, boosted by a 6.2% jump in durable goods spending and 2.8% increases on both nondurables and services. Nominal spending (not adjusted for price variation) grew 0.3% for the month and was up 3.5% over the past year. The increased spending was funded by a 0.4% gain in personal income (“real” personal income also grew by 0.4%). Personal income has increased 4.3% over the past year. The savings rate for July of +4.7% was up 2/10ths of a percentage point from June.
 Following last week’s report on previously owned homes, new home sales grew in July. The Census Bureau put the seasonally adjusted annualized sales rate of new homes at 507,000 units, up 5.4% for the month and 25.8% above year ago levels. Sales grew during the month in 3 of 4 Census regions, with a 6.9% drop in the Midwest being the exception. Builders were still maintaining a tight inventory of homes—there were 218,000 unsold new homes at the end of June, up 6.9% versus a year earlier but still representing only a 5.2 month supply. Nevertheless, the median sales price of $285,900 was up only 2.0% from a year earlier (although this is likely reflective of a greater percentage of smaller (less expensive) homes sold during the period).
 Durable goods orders gained for a 2nd straight month in July. The Census Bureau reported new orders for durable goods were at a seasonally adjusted $241.1 billion, a 2.0% gain for the month. Transportation goods orders increased 4.7% during the month, despite drops of 6.0% and 13.1% for civilian and defense aircraft orders, respectively. Motor vehicle orders gained 4.0%. Net of transportation goods, new orders grew 0.6%, thanks to a 2.0% increase in orders for computers/electronic products, a 1.5% gain in machinery orders and a 1.3% improvement in orders for electrical equipment/appliances. Orders for non-defense capital goods excluding aircraft (a closely watched measure of business investment) increased 2.2% during the month.
 One measure of consumer sentiment prospered in August while another showed the detrimental effects of stock market volatility. The Conference Board’s Consumer Confidence Index surged 10.5 points during August to a seasonally adjusted 101.5 (1985 = 100), its best reading since January. The present conditions bounced up 11.1 points to 115.1 (its best since November 2007) while the expected conditions index added 10.2 points to 92.5. The press release links the jump in sentiment to “a more favorable appraisal of the labor market” but also notes that income expectations “were little improved.”
Meanwhile, the University of Michigan’s Index of Consumer Sentiment lost 1.2 points during August to a seasonally adjusted reading of 91.9 (1966 Q1 = 100). Even with the drop, the index remained well above the August 2014 reading of 82.5. The current conditions index lost 2.1 points (to 105.1) while the expectations index inched down by 7/10ths of a point to 83.4. The press release said the drop was “mainly due to the recent volatility in stock market,” even though the survey results do not reflect the rollercoaster nature of the markets over the past week or so. The press release said the survey results indicated real consumer spending will grow “a still healthy” 2.9% for all of 2015, although warning that “consumer sentiment must be carefully monitored in the months ahead.”
Other data released over the past week that you might find of interest:
– Jobless Claims (week ending August 22, 2015): 271,000 (-6,000 vs. week earlier); 4-week moving average: 272,500 (+1,000 vs. week earlier).
– Chicago Fed National Activity Index (July 2015): +0.34 (up 41-basis points vs. June). 3-month moving average: -0.08 (up 9-basis points vs. June)
– Pending Home Sales (July 2015): 110.9 (up 0.5 vs. June, 2001 = 100)
The opinions expressed here are not necessarily those of Kevin’s current and previous employers. No endorsements are implied.
