
Last week featured several housing market metrics at post-recession highs and a forward looking measure of economic activity that softened in July. Here’s the U.S. economic data you missed during the week ending August 21.
 Sales of previously owned homes edged up in July, despite tight inventories and rising prices. The National Association of Realtors reports existing home sales grew 2.0% during the month to a seasonally adjusted annualized rate (SAAR) of 5.59 million units. This was up 10.3% from the same month a year ago and the best sales pace since February 2007, when the then hoped for “soft landing” for the cooling housing market was quickly turning into a hard crash. July’s gains were centered in the South (+4.1%) and the West (+3.2%), while sales were unchanged in the Midwest and eased 2.8% in the Northeast. NAR noted that the share of transactions comprising of first-time buyers fell by 2 percentage points to 28%, blaming both tight inventories and rising prices. At the end of the month, there were 2.24 million homes for sale (off 4.7% from a year earlier and the equivalent to a 4.8 month supply). The median sales price of $234,000 was 5.6% above year ago levels.
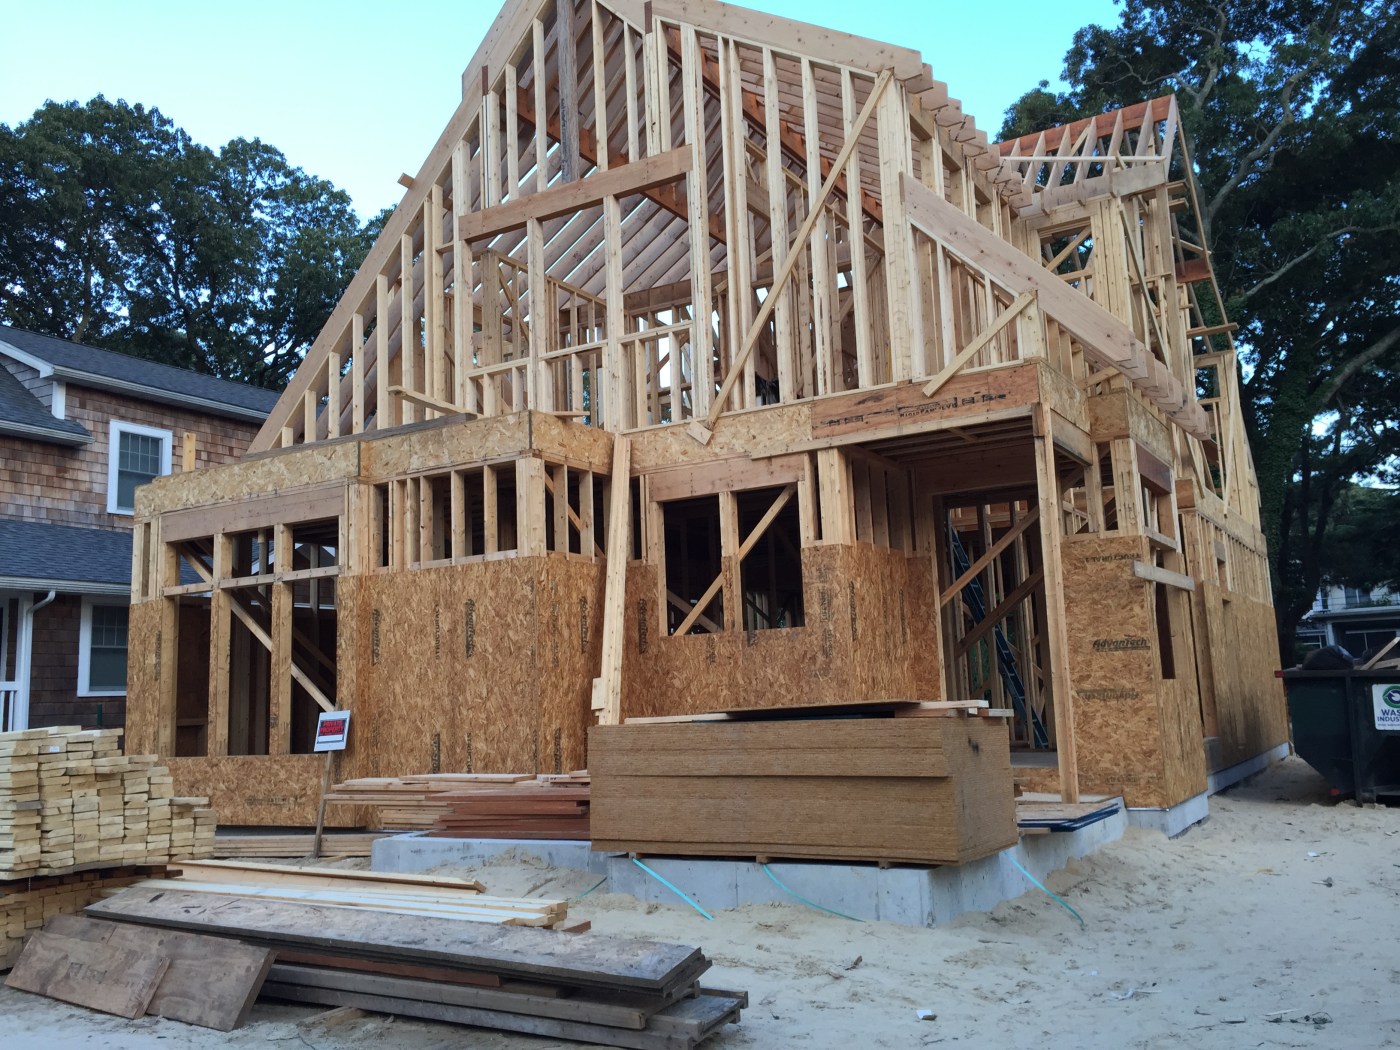
 Housing starts and homebuilder sentiment are at post-recession highs. The Census Bureau’s SAAR estimate for housing starts for July of 1.206 million units was virtually unchanged from June but was 10.1% above the July
2014 reading and its highest point since October 2007. (Note that housing starts remained well below the 1.5-2.0 million pace we saw for years before the last recession.) Starts of single-family homes jumped 12.8% during the month to 782,000 units (+19.0% vs. July 2014) while those for
multi-family units slumped 17.3% to 424,000 units (-3.2% vs. July 2014). Looking into the future, permitting activity suggests that we may see a slowdown in starts over the short-term. The SAAR count of issued construction permits fell 16.3% during July to 1.119 million permits. Even with the drop, this was 7.5% above year ago levels, with positive 12 -month comparables for both single-family and multi-family permits. The number of
housing units completed during the month grew 2.4% to 987,000 units, up 14.6% from a year earlier.
With a 1-point gain during August, the Housing Market Index (HMI) from the National Association of Home Builders grew to its best reading since November 2005 at 61. The measure of homebuilder confidence has been above a reading of 50—where a greater percentage of survey respondents characterize housing market conditions as being “good” rather than “poor”—for 14 straight months. The HMI grew in 3 of 4 Census regions, but fell in the Northeast. Indices for current sales of single-family homes and traffic of potential buyers both improved from their July readings while the index for expected sales over the next 6 months was unchanged for the month. NAHB’s press release was largely positive, noting that the results were “consistent” with “a gradual strengthening of the single-family housing sector in 2015.”
 Consumer prices remained largely in check in July. According to the Bureau of Labor Statistics, the Consumer Price Index (CPI) had its smallest monthly increase since April with a seasonally adjusted 0.1% gain. Energy CPI also grew 0.1% as the gasoline index increased 0.9% but indices for fuel oil (-3.4%), utility delivered natural gas (-1.4%) and electricity each fell (-0.4%). (Note that this report does not reflect the price drops we are now seeing at the gas pump.) Meanwhile, food CPI increased 0.2%. Net of both energy and food, core CPI grew 0.1% for the month and was up 1.8% over the past year. Growing were prices for apparel (+0.3%) and shelter (+0.4%) while prices for new vehicles (-0.2%) and used vehicles (-0.6%) both fell.
 A measure of leading economic indicators unexpectedly fell in July, but we probably should not be too concerned about the drop. The Conference Board’s Leading Economic Index slid 3/10ths of a point to 123.3. While 7 of the index’s 10 components improved during the month, it was the aforementioned sharp decline in housing permits during July that pulled the LEI down. The coincident index added 2/10ths of a point to 112.5, with all 4 of the index’s components making positive contributions while the lagging index grew by 4/10ths of a point to 118.1 (4 of 7 index components gained during the month). The Conference Board’s press release indicated that the group was not alarmed by the drop in the leading index, stating that the LEI “…is still pointing to moderate economic growth through the remainder of the year.”
 2/3rds of states enjoyed gains in nonfarm payrolls in July. The Bureau of Labor Statistics reports 34 states saw nonfarm payrolls increase during the month, led by California (+80,700), Texas (+31,400) and Florida (+30,500). Employment fell in the other 16 states and in the District of Columbia, with the biggest drops occurring in New Jersey (-13,600), Louisiana (-4,500) and Kansas (-4,300). Over the past year, nonfarm payrolls have increased in 47 states, led by Utah (+4.4%), Nevada (+3.7%) and Florida (+3.5%). Compared to July 2014 levels, employment contracted in West Virginia (-2.5%) and North Dakota (-0.6%) and was unchanged in Alaska.
Other data released over the past week that you might find of interest:
– Jobless Claims (week ending August 15, 2015): 277,000 (+3,000 vs. week earlier); 4-week moving average: 271,500 (+5,500 vs. week earlier).
– Minutes from the most recent meeting of the Federal Open Market Committee.
The opinions expressed here are not necessarily those of Kevin’s current and previous employers. No endorsements are implied.
