
Inflation remained hot late in the summer. Here are the five things we learned from U.S. economic data released during the week ending September 16.

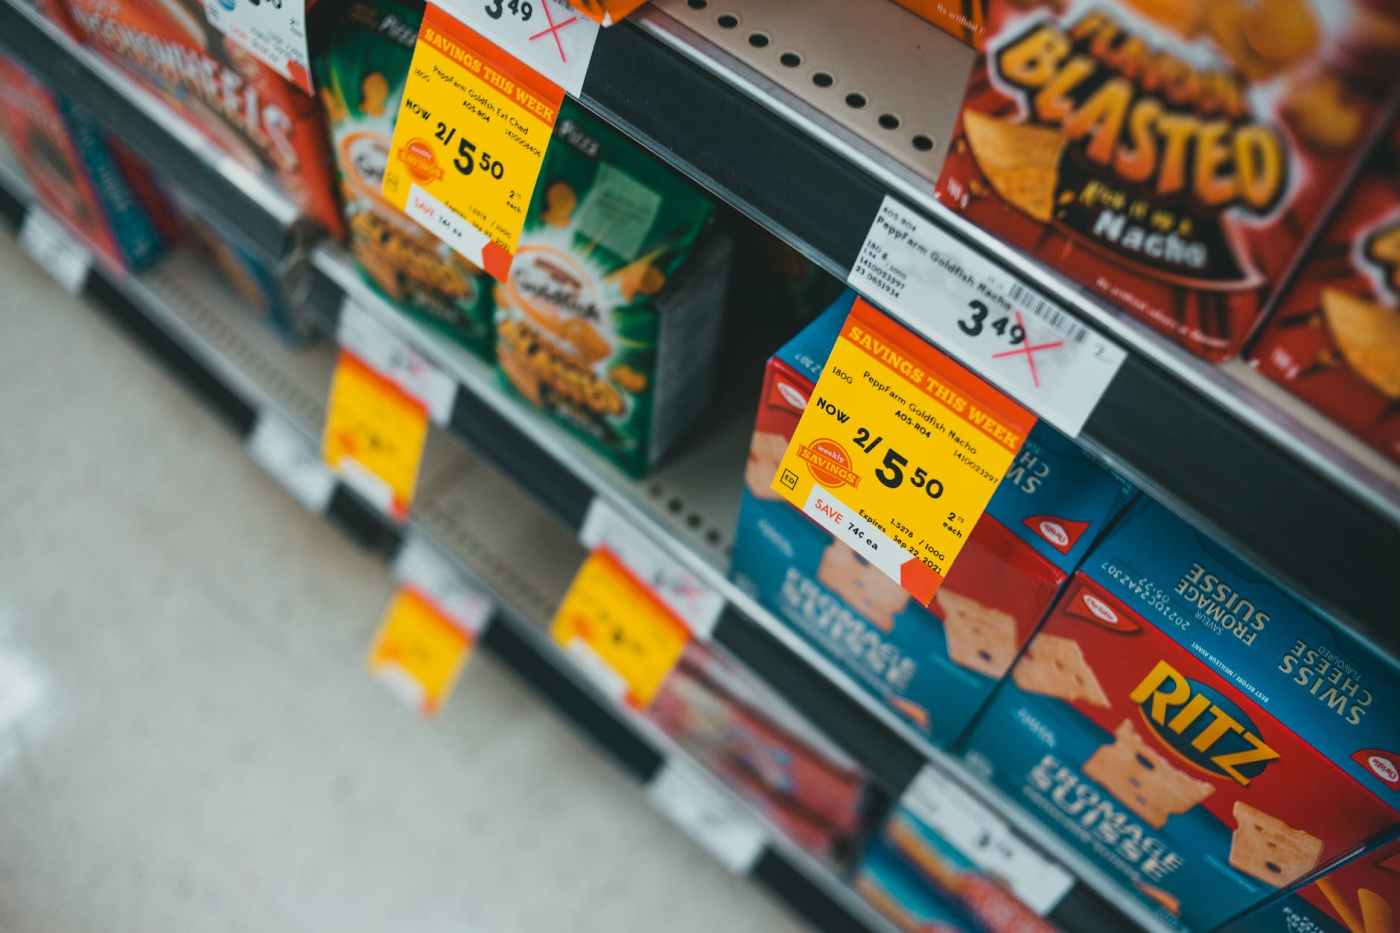
Consumer prices—except for gasoline—rose in August. The Consumer Price Index (CPI) inched up a seasonally adjusted 0.1 percent. This was this second straight month of relatively little growth in the headline Bureau of Labor Statistics price measure. But the good news largely came from the sharp 5.0 percent drop in energy CPI, with gasoline prices freefalling 10.6 percent. Meanwhile, food prices surged 0.8 percent, with notable rises for meats/poultry/fish/eggs, vegetables, and alcohol. Net of both energy and food, core CPI jumped 0.6 percent. Prices rose for medical care services (+0.8 percent), new vehicles (+0.8 percent), shelter (+0.7 percent), transportation services (+0.5 percent), apparel (+0.2 percent), and medical care commodities (+0.2 percent). Used car/truck prices slipped 0.1 percent. CPI was up a whopping 8.3 percent from a year earlier, with the 12-month comparable for core prices at an inflated +6.3 percent.

Meanwhile, wholesale prices were more stable. The Bureau of Labor Statistics’ Producer Price Index (PPI) for final demand slipped 0.1 percent in August, following a 0.4 percent drop in July. Energy wholesale prices fell 6.0 percent (gasoline -12.7 percent), while food PPI held steady. Net of both energy and food, core PPI increased 0.2 percent. Wholesale goods prices fell 1.2 percent but increased 0.2 percent after removing energy and food. Services PPI jumped 0.4 percent, pushed up by a 0.8 percent jump in trade services PPI (wholesaler and retailer margins). Wholesale prices have risen 8.8 percent over the past year, with the core measure up 5.6 percent over the same 12 months.

Soft retail sales in August. Retail and food services sales grew 0.3 percent to a seasonally adjusted $683.3 billion. Plummeting gas prices led to a 4.2 percent drop in gas station sales (the Census Bureau data series does not adjust for price changes), while sales at automobile/parts dealers surged 2.8 percent. Net of both, core retail sales gained 0.3 percent in August, matching its July advance. Sales increased at retailers focused on building materials (+1.1 percent), sporting goods/hobbies (+0.5 percent), apparel (+0.4 percent), and groceries (+0.2 percent). Sales also gained at restaurants/bars (+1.1 percent) and department stores (+0.9 percent). Sales slumped at furniture retailers (-1.3 percent), health/personal care stores (-0.6 percent), nonstore retailers (-0.7 percent), and electronics/appliance stores (-0.1 percent). Overall retail sales were 9.3 percent ahead of their year-ago pace, while the 12-month comparable for core retail sales at +8.0 percent).

Manufacturing wobbled in August. The Federal Reserve estimates manufacturing production eked out a seasonally adjusted 0.1 percent increase following a 0.6 percent bounce in July. Nondurable goods production advanced 0.2 percent, while that of durables held steady. The very volatile automotive sector saw production fall 1.4 percent during the month. Overall industrial production slipped 0.2 percent following a half-point gain in July. Mining output held steady, while that at utilities fell 2.3 percent. Compared to a year earlier, manufacturing production remained 3.3 percent over their year-ago pace and overall industrial production was up 3.7 percent.

Consumer sentiment held stable in early September. The Index of Consumer Sentiment added 1.3 points from August to a seasonally adjusted 59.5 (1966Q1=100). The University of Michigan, which was at a reading of 72.8 a year earlier, has been near its all-time low since March. The current conditions measure inched up 3/10ths of a point to 58.9 (September 2021: 80.1), while the expected conditions index added 1.9 points to 59.9 (September 2021: 68.1). The press release noted that “consumers showed signs of uncertainty over the trajectory of the economy.”
Other U.S. economic data released over the past week:
- Jobless Claims (Week ending September 10, 2022, First-Time Claims, seasonally adjusted): 213,000, -5,000 vs. the previous week, -150,000 vs. the same week a year earlier). 4-week moving average: 224,000 (-40.3% vs. the same week a year earlier).
- Import Prices (August 2022, All Imports, not seasonally adjusted): -1.0% vs. July 2022; +7.8% vs. August 2021. Nonfuel Imports: -0.2% vs. July 2022; +3.9% vs. August 2021.
- Export Prices (August 2022, All Exports, not seasonally adjusted): -1.6% vs. July 2022; +10.8% vs. August 2021.
- Small Business Optimism (August 2022, Index (1986=100), seasonally adjusted): 91.8 (vs. July 2022: 89.9; August 2021: 100.1).
- Monthly Treasury Statement (August 2022, Federal Budget Deficit): -$945.7 billion through the first 11 months of FY2022 (vs. -$2.711 trillion through the first 11 months of FY2022).
- Business Inventories (July 2022, Manufacturers’ and Trade Inventories, seasonally adjusted): $2.434 trillion (+0.6% vs. June 2022; +18.4% vs. July 2021).
- State Employment (August 2022, Nonfarm Payrolls, seasonally adjusted): Increased in 10 states, decreased in 1 state, and stable in 39 states and the District of Columbia vs. July 2022. Increased in 46 states and the District of Columbia and stable in 4 states vs. August 2021.
The opinions expressed here are not necessarily those of Kevin’s current employer. No endorsements are implied.
