
The Federal Reserve cuts its short-term interest rate target and sent a mixed message on what may be next. Here are the five things we learned from U.S. economic data released during the week ending September 20.
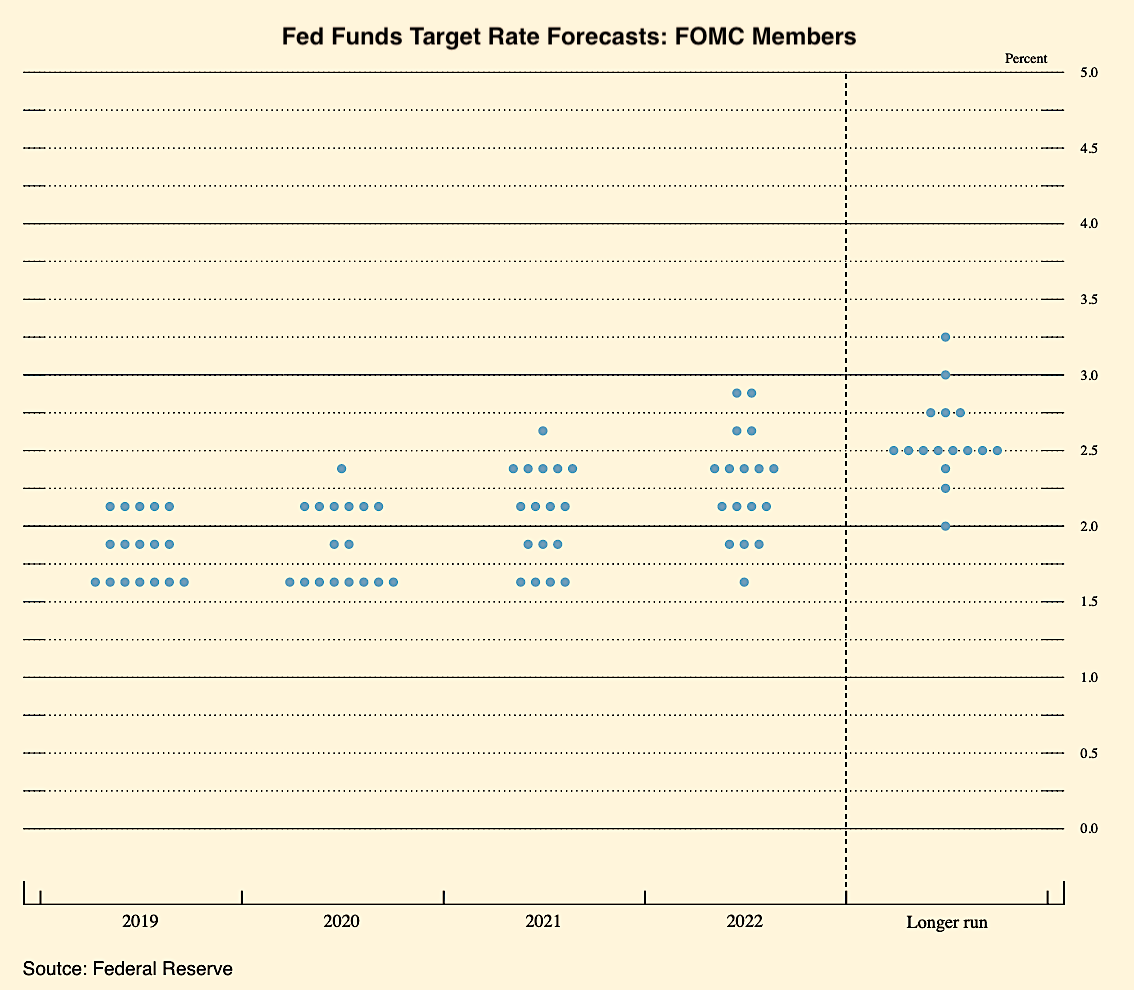
 A divided Fed lowered its short-term interest rate target. In the statement released following this past week’s meeting of the Federal Open Market Committee (FOMC) noted that the U.S. economy was “rising at a moderate rate,” the “labor market remains strong,” and household spending was robust. But the statement also indicated that both business investment and exports “have weakened” and inflation remains below the Fed’s two-percent target. As a result, the FOMC voted to cut the fed funds target rate by a quarter-percent point to a range of 1.75 percent and 2.00 percent because “of the implications of global developments for the economic outlook as well as muted inflation pressures.” The decision was not unanimous: two voting members wanted to leave the fed funds target rate unchanged while one member sought a half-point rate cut.
Looking at economic forecasts by FOMC members released in conjunction with the policy statement, it is clear that there is even more disagreement on what is next. Seven voting members anticipate at least one more rate cut before the end of 2019, while five members expect this past week’s rate cut would be the final cut of the year and five had not expected even this rate cut. The same forecasts have the U.S. economy expanding at 2.0 percent next year with an unemployment rate of 3.7 percent and inflation just below the Fed’s target at 1.9 percent.
 Forward-looking economic measures suggest slowing growth. The Conference Board’s Leading Economic Index (LEI) held steady in August at a reading of 112.1, following a 4/10ths of a point increase during the prior month. The LEI has grown a modest 1.1 percent over the past year. Five of the ten LEI components made positive contributions, led by housing building permits. The coincident index added 3/10ths of a point to 106.4 (+1.6 percent versus August 2018). All four components of the coincident index made positive contributions, led by industrial production. The lagging index shed 3/10ths of a point to 108.2 (+3.0 percent versus August 2018) as only three of seven components made a positive contribution. The press release said that the leading index was “consistent with a slow but still expanding economy, which has been primarily driven by strong consumer spending and robust job growth.”
 Manufacturing production rebounded in August. The Federal Reserve tells us that manufacturing output grew a seasonally adjusted 0.5 percent during the month following a 0.4 percent pullback in July. Output for durable and nondurable goods each rose 0.5 percent, with the former boosted by higher than one-percent gains for machinery, primary metals, and nonmetallic mineral goods. Plastics/rubber products and chemicals lifted the nondurables figure. Overall industrial production grew 0.6 percent in August after having had slipped 0.1 percent during the prior month. Mining output jumped 1.4 percent following a 1.5 percent decline in July (caused by a temporary slowdown in oil extraction resulting from Hurricane Barry). Production at utilities grew 0.6 percent in August. Even with its expansion in August, manufacturing output was 0.4 percent smaller than that of a year earlier while the 12-month comparable for overall industrial production was a modest +0.4 percent.
 Existing home sales edged up in August. Sales of previously owned homes gained 1.3 percent in August to a seasonally adjusted annualized rate (SAAR) of 5.49 million units (up 2.6 percent from August 2018). The National Association of Realtors’ measure grew in three of four Census regions—Northeast (+7.6 percent), Midwest (+3.1 percent), and South (+0.9 percent)—but fell 3.4 percent in the West. Home sales in four Census regions had positive 12-month comparables. Inventories of unsold homes remained tight, falling 2.1 percent during the month to 1.86 million houses (-2.6 percent versus August 2018). This was the equivalent to a 4.1 month supply. The median sales price has grown 4.7 percent over the past year to $278,200. The press release credits the recent drop in mortgage interest rates for the rise in home sales.
 Housing starts bloomed in August. The Census Bureau reports that housing starts rose 12.3 percent during the month to a seasonally adjusted annualized rate (SAAR) of 1.215 million units. This left the measure 6.6 percent ahead of its year-ago mark. Single-family home starts increased 4.4 percent while those of multi-family units surged 30.9 percent. Leading towards the future, the number of issued housing permits gained 7.7 percent in August to an annualized 1.419 million permits (+12.0 percent versus August 2018). The annualized count of permits for single-family homes grew 4.5 percent during the month while that for homes with five or more units jumped 14.9 percent. Housing completions gained 2.4 percent in August to an annualized 1.294 million homes, up 5.0 percent from a year earlier.
Other U.S. economic data released over the past week:
– Jobless Claims (week ending September 14, 2019, First-Time Claims, seasonally adjusted): 208,000 (+6,000 vs. previous week; -4,000 vs. the same week a year earlier). 4-week moving average: 212,250 (+0.5% vs. the same week a year earlier).
– Housing Market Index (September 2019, Index (>50 = ”Good” housing market), seasonally adjusted): 68 (vs. August 2019: 67, vs. September 2018: 67).
– State Employment (August 2019, Nonfarm Payrolls, seasonally adjusted): vs. July 2019: Grew in 5 states, Decreased in 1 state, and Unchanged in 44 states and the District of Columbia. Vs. August 2018: Grew in 26 states and Unchanged in 34 states and the District of Columbia.
– Treasury International Capital (July 2019, Net Foreign Purchases of Domestic Securities, not seasonally adjusted): +$72.3 billion (vs. June 2019: +$65.3 billion, vs. July 2018: +$34.5 billion).
The opinions expressed here are not necessarily those of Kevin’s current employer. No endorsements are implied.
