
The Fed raises its target for short-term interest rates as inflation moves ever so closer to targeted levels. Here are the five things we learned from U.S. economic data released during the week ending June 15.
 The Fed boosts short-term interest rates and appears ready to do so twice more again this year. The policy statement released following this past week’s meeting of the Federal Open Market Committee (FOMC) characterized economic activity as “rising at a solid rate” and that the labor market “continued to strengthen” with core inflation moving closer to the Fed’s two-percent target rate. The statement also noted that risks to future economic activity as being ”roughly balanced.” As a result, the committee voted unanimously to boost the fed funds rate by 25-basis points to a range between 1.75 and 2.00 percent. This was the FOMC’s second rate hike of 2018 but keeps the short-term interest target in a range the committee views as “accommodative.”
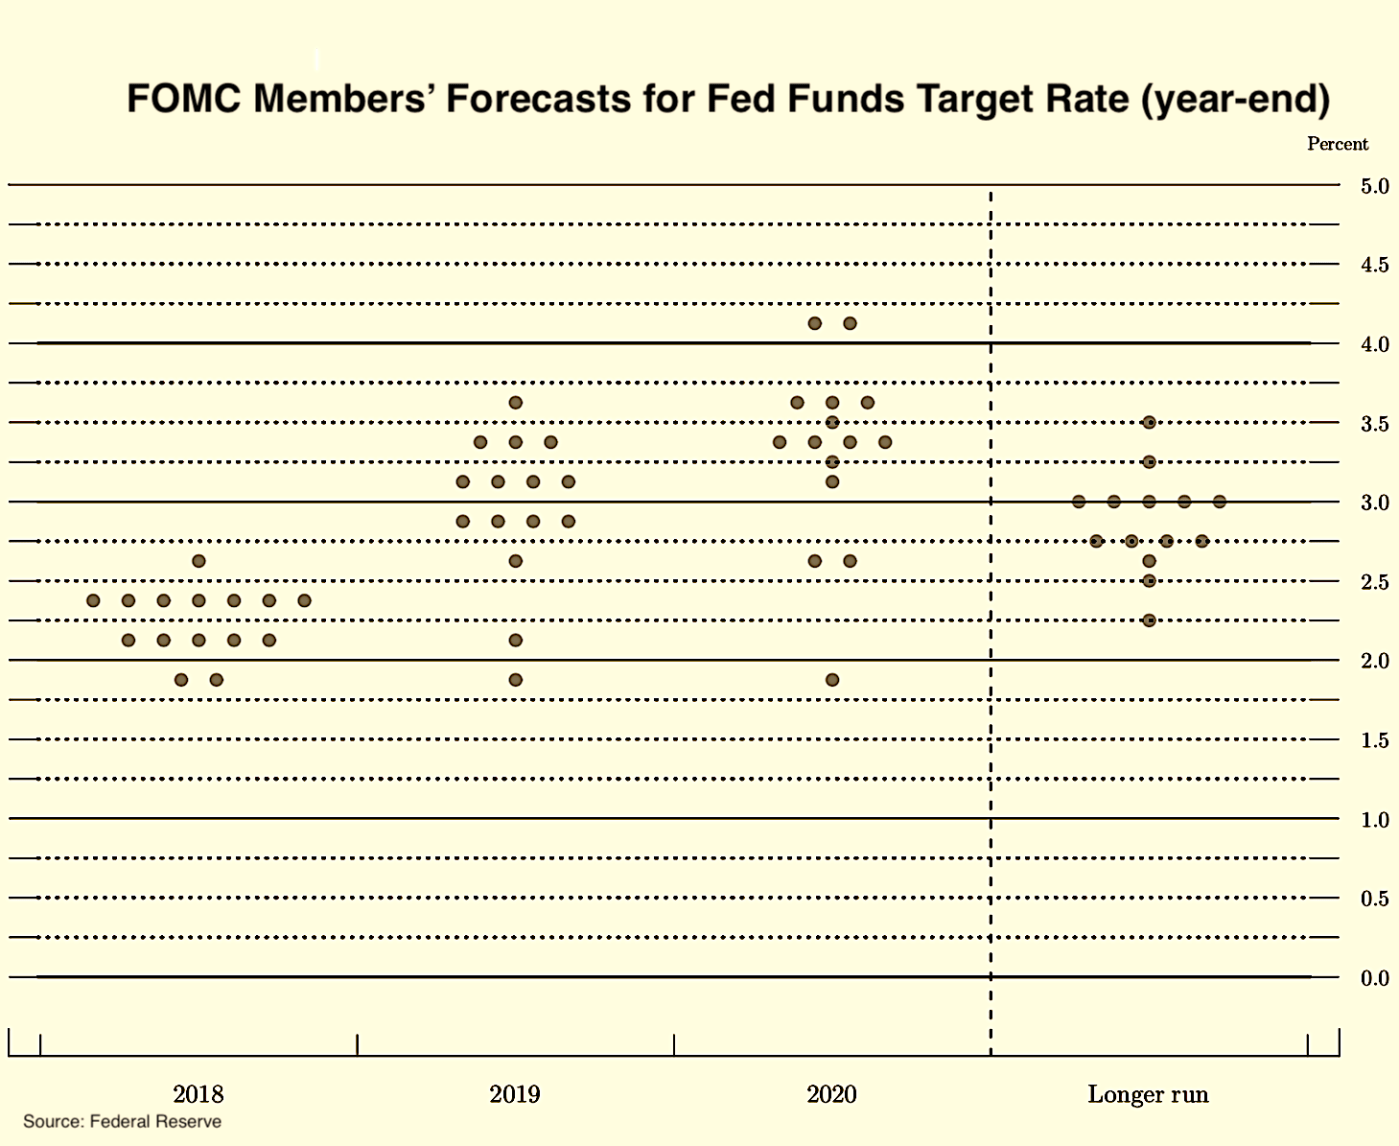
Accompanying the policy statement were the updated economic projections of Federal Reserve Board members and Federal Reserve Bank presidents, which highlight a more optimistic view of near-term conditions. For example, the median forecast for 2018 economic growth increased by 1/10th of a percentage point to +2.8 percent and the expected unemployed rate dropped by 2/10ths of a percentage point to 3.6 percent. The forecasters also see a greater firming of inflation with the core PCE deflator (the Fed’s preferred measure of inflation) at +2.1 percent, up from the prior forecast of +1.9 percent. As a result, the median forecast for the fed funds target rate suggests two more quarter-point rate hikes this year (up from a single additional rate bump previously anticipated). Further, the median forecast points to three quarter-point hikes in 2019 and one rate hike in 2020.
 Inflation continued to build steadily in May. The Consumer Price Index (CPI) grew 0.2 percent on a seasonally adjusted basis for the third time in four months, per the Bureau of Labor Statistics. Energy prices jumped 0.9 percent, as gasoline prices gained 1.7 percent. Food CPI held steady during the month. Net of energy and food, core CPI increased 0.2 percent and has grown 2.2 percent over the past year. (The 12-month comparable for the headline index was +2.8 percent). Jumping during the month were prices for medical commodities (+1.3 percent), new vehicles (+0.3 percent), and shelter (+0.3 percent) while prices declined during the month for used cars/trucks (-0.9 percent) and medical care services (-0.1 percent).
Meanwhile, the Producer Price Index (PPI) for final demand soared 0.5 percent (seasonally adjusted), its fastest rate of growth since January. The core measure, which nets out energy, food, and trade services, grew at a more modest 0.1 percent for a second consecutive month. Wholesale prices for final demand goods swelled 1.0 percent, led by the 4.6 percent surge in wholesale energy prices (PPI for gasoline: +9.8 percent). Final demand food PPI eked out a 0.1 percent increase. Net of energy and food, core final demand goods PPI gained 0.3 percent. PPI for final demand services increased 0.3 percent for the fourth time in five months, which included the impact of a 0.9 percent advance in prices for trade services (reflecting larger retailer and wholesaler margins). Over the past year, final demand PPI has jumped 3.1 percent during which the core wholesale price measure (net of energy, food, and trade services) has risen 2.6 percent.
 Retail sales surged in May. The Census Bureau estimates retail and food sales were at a seasonally adjusted $502.0 billion, up 0.8 percent from April and 5.9 percent from a year earlier. Motor vehicle sales jumped 0.5 percent while higher prices at the pump resulted in a 2.0 percent rise in gas station sales. Net of sales at auto dealers/parts stores and gas stations, core retail sales rose 0.8 percent to $443.1 billion (+5.1 percent versus April 2017). May was a good month for building material/garden supplies stores (+2.4 percent), department stores (+1.5 percent), apparel retailers (+1.3 percent), restaurants/bars (+1.3 percent), and health/personal care retailers (+0.5 percent). Sales slowed during the month at furniture stores (-2.4 percent) and sporting goods/hobby retailers (-1.1 percent).
 Manufacturing decelerated in May. Per the Federal Reserve’s Industrial Production report, manufacturing output slumped 0.7 percent on a seasonally adjusted basis, leaving it 1.7 percent ahead of its year-ago pace. The report links much of the decline to a “major fire at a parts supplier” that had disrupted truck assemblies. Net of vehicle production, manufacturing slowed by a more modest 0.2 percent. Output of durables fell 1.2 percent (motor vehicles production plummeted 6.5 percent) while that of nondurable slipped 0.1 percent. Overall industrial production decreased 0.1 percent during the month but was up 3.5 percent over the past 12 months. Mining output grew for the fourth straight month (+1.8 percent versus April 2018 and +12.6 percent versus May 2017), led by increased oil and gas extraction. Higher demand for electricity led to a 1.0 percent increase in output at utilities.
 Small business owners’ optimism blossomed during the spring. The National Federation of Independent Business’ Index of Small Business Optimism jumped by 3.0 points to a seasonally adjusted reading of 107.8. Not only was this a post-recession high for the sentiment measure, it also was its second-best reading in the index’s second-best reading ever (a 45-year history). Eight of the index’s ten components improved from their April readings, led by expected real sales (+10 points), expectations for the economy (+7 points), on whether it is a good time to expand (+7 points), and earning trends (+4 points). While noting difficult in their ability to find qualified workers to hire, the press release stated employers “now have more resources to commit to attracting candidates.”
Other U.S. economic data released over the past week:
– Jobless Claims (week ending June 9, 2018, First-Time Claims, seasonally adjusted): 218,000 (-4,000 vs. previous week; -22,000 vs. the same week a year earlier). 4-week moving average: 224,250 (-8.1% vs. the same week a year earlier).
– Import Prices (May 2018, All Imports, not seasonally adjusted): +0.6% vs. April 2018, +4.3% vs. May 2017. Nonfuel imports: +0.2% vs. April 2018, +1.9% vs. May 2017.
– Export Prices (May 2018, All Exports, not seasonally adjusted): +0.6% vs. April 2018, +4.9% vs. April 2018, Nonagricultural Exports: +0.5% vs. April 2018, +4.9% vs. May 2017.
– University of Michigan Consumer Sentiment (June 2018-preliminary, Index of Consumer Sentiment, seasonally adjusted): 99.3 (vs. May 2018: 98.0, June 2017: 95.0).
– Business Inventories (April 2018, Manufacturing and Trade Inventories, seasonally adjusted): $1.930 trillion (+0.3% vs. March 2018, +4.4% vs. April 2017).
– Monthly Budget Statement (May 2018, U.S. Budget Surplus/Deficit): -$146.8 billion (vs. May 2017: -$88.4 billion). Deficit over first 8 months of FY 2019: -$532.2 billion (vs. +23.0% vs. first 8 months of FY 2018).
The opinions expressed here are not necessarily those of Kevin’s current employer. No endorsements are implied.
