
Even though the storm hit Texas during the final days of August, the impact of Hurricane Harvey was already showing up in economic data. Here are the five things we learned from U.S. economic data released during the week ending September 15.
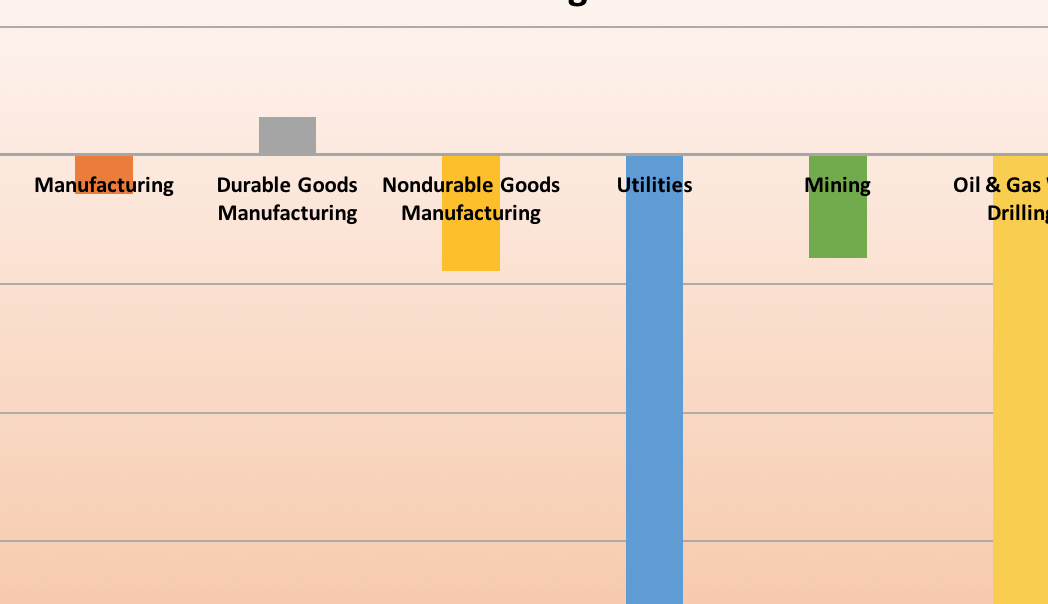
 Hurricane Harvey slowed industrial production at the end of August. The Federal Reserve indicates that industrial production fell for the first time in seven months with a 0.9 percent decline. Manufacturing output dropped 0.3 percent after holding steady in July. The Fed estimates both measures dropped by 3/4ths of a percentage point due to storm-related effects. Durable goods output grew 0.3 percent during the month while that of nondurables fell 0.9 percent. Automobile and aerospace production boosted the former while drops in the output of chemicals and petroleum/coal products pulled down the latter. Also falling were outputs at utilities (-5.5 percent) and in mining (-0.8 percent), with the latter the result of large declines in oil and gas well drilling and servicing. Capacity utilization also fell, shedding 8/10ths of a percentage point to 76.1 percent (its lowest reading since March). Manufacturing sector capacity utilization dropped by 3/10ths of a percentage point to 75.3 percent.
 Retail sales slipped in August, although it is unclear how much of that drop was due to Harvey. The Census Bureau estimates U.S. retail and food services sales were at a seasonally adjusted $474.8 billion, off 0.2 percent from the previous month. Hurting the headline number was softer sales at auto dealers (and parts stores), which saw sales drop 1.6 percent. Net of auto dealers/parts stores, retail sales grew 0.2 percent—although this figure is pulled up by a 2.5 percent rise in gas station sales (largely due to higher gasoline prices). Sales also grew at furniture retailers (+0.4 percent), restaurants/bars (+0.3 percent), grocery stores (+0.3 percent), and general merchandisers (+0.2 percent). August was not a particularly good month for apparel retailers (-1.0 percent), electronics/appliance stores (-0.7 percent), building materials retailers (-0.5 percent), and department stores (-0.1 percent). The Census Bureau statement included comments about possible retail sales impacts resulting from Hurricane Harvey, noting that they received “indications from the companies that the hurricane had both positive and negative effects on their sales data while others indicated they were not impacted at all.”
 Higher gasoline prices led to firmer consumer and wholesale prices in August. The Consumer Price Index (CPI) jumped 0.4 percent on a seasonally adjusted basis during the month, the largest single-month increase in the Bureau of Labor Statistics measure in seven months. Energy and shelter were responsible for much of the gain in consumer prices. Energy CPI jumped 2.8 percent, pulled up by a 6.3 percent gain in gasoline prices and a 2.9 percent increase in fuel oil. (Note that these figures largely do not reflect the impact of the sharp rise in gas prices caused refineries temporary closing along the Gulf Coast following Hurricane Harvey.) Food CPI inched up 0.1 percent. Net of energy and food, core CPI increased 0.2 percent, its largest single-month gain since February. Growing were prices for shelter (+0.5 percent), transportation services (+0.4 percent), medical care services (+0.2 percent), and apparel (+0.1 percent). Prices fell for used cars (-0.2 percent) and medical care commodities (-0.1 percent) while new car prices did not change from July. Over the past year, CPI has grown 1.9 percent while the core CPI measure has increased 1.7 percent.
The final demand Producer Price Index (PPI) grew 0.2 percent during August following a 0.1 percent decline in July. Net of food, energy, and trade services, core final demand PPI increased 0.2 percent during August after holding firm in July. The former has jumped 2.4 percent over the past year while the 12-month comparable for the core index was at +1.9 percent. Wholesale prices for final demand goods leaped 0.5 percent (its biggest month-to-month since April), led by a 3.3 percent jump in PPI for final demand energy goods (gasoline PPI surged 9.5 percent). Food PPI fell 1.3 percent, pulled down by lower meat prices. Net of energy and food, wholesale prices for core goods increased 0.2 percent (its biggest gain since April). Final demand services PPI eked out a 0.1 percent gain.
 The number of job openings and people hired both edged up during July. Per the Bureau of Labor Statistics, there were a seasonally adjusted 6.170 million job openings at the end of the July, up 54,000 from a month earlier and up 3.3 percent from a year earlier, and its highest reading in the 17-year history of the data series. Private sector employers had 5.657 million job openings at the end of the month, up 4.4 percent from the July 2016 count. Among the industries with large year-to-year percentage gains in job opening were mining/logging (+130.8 percent), wholesale trade (+20.2 percent), leisure/hospitality (+12.9 percent), and financial activities (+9.9 percent). Employers hired 5.501 million people during July, up 69,000 from June and 3.2 percent from a year earlier. Private sector employers hired 5.164 million people, up 4.4 percent from a year earlier. The largest percentage year-to-year increases in hiring occurred in mining/logging (+47.8 percent), manufacturing (+20.1 percent), financial activities (+10.4 percent), and construction (+9.3 percent). 5.332 million people left their jobs during July, up 23,000 for the month and 6.6 percent from July 2016. 3.164 million people voluntarily quit their jobs during the month (+4.4 percent versus July 2016) while layoffs totaled 1.783 million (+10.8 percent versus July 2016).
 Employers expect to continue hiring during the final months of 2017. Twenty-one percent of the 11,500 companies surveyed by Manpower indicated plans to hire more workers during the third quarter of 2017 while six percent expect to shed workers. The resulting difference—the Net Employment Outlook—of +15 increases to +17 after seasonal adjustments. This matched the Net Employment Outlook reading from three months earlier but slipped a point from a year earlier. The measure was positive for all 13-tracked industries, with the highest readings for leisure/hospitality (+28), professional/business services (+22), and transportation/utilities (+20). Similarly, there were positive seasonally adjusted Net Employment Outlooks in all four Census regions: Northeast (+18), Midwest (+16), South (+18), and West (+18).
Other U.S. economic data released over the past week:
– Jobless Claims (week ending September 9, 2017, First-Time Claims, seasonally adjusted): 284,000 (-14,000 vs. previous week; +26,000 vs. the same week a year earlier). 4-week moving average: 263,250 (+1.7% vs. the same week a year earlier).
– Small Business Optimism Index (August 2017, Index (1986=100), seasonally adjusted): 105.3 (vs. July 2017: 105.2; August 2016: 94.4).
– University of Michigan Index of Consumer Sentiment (September 2017-preliminary, Index (1966Q1=100), seasonally adjusted): 95.3 (vs. August 2017: 96.8; September 2016: 91.2).
– Manufacturers’ and Trade Inventories (July 2017, Business Inventories, seasonally adjusted): $1.874 trillion (+0.2% vs. June 2017, +3.0% vs. July 2016).
– Regional and State Employment (August 2017, Nonfarm Payrolls, seasonally adjusted): vs. July 2017: payrolls grew significantly in 6 states and declined significantly in 3 states; vs. August 2016: payrolls increased significantly in 29 states and in the District of Columbia. No state suffered a significant year-to-year decline.
– Federal Government Treasury Statement (August 2017, Surplus/Deficit): -$107.7 billion (vs. July 2017: -$42.9 billion; vs. August 2016: -$107.1 billion).
The opinions expressed here are not necessarily those of Kevin’s current and previous employers. No endorsements are implied.
