
The trade picture barely changed during July, but the service sector perked up in August. Here are the five things we learned from U.S. economic data released during the week ending September 8.
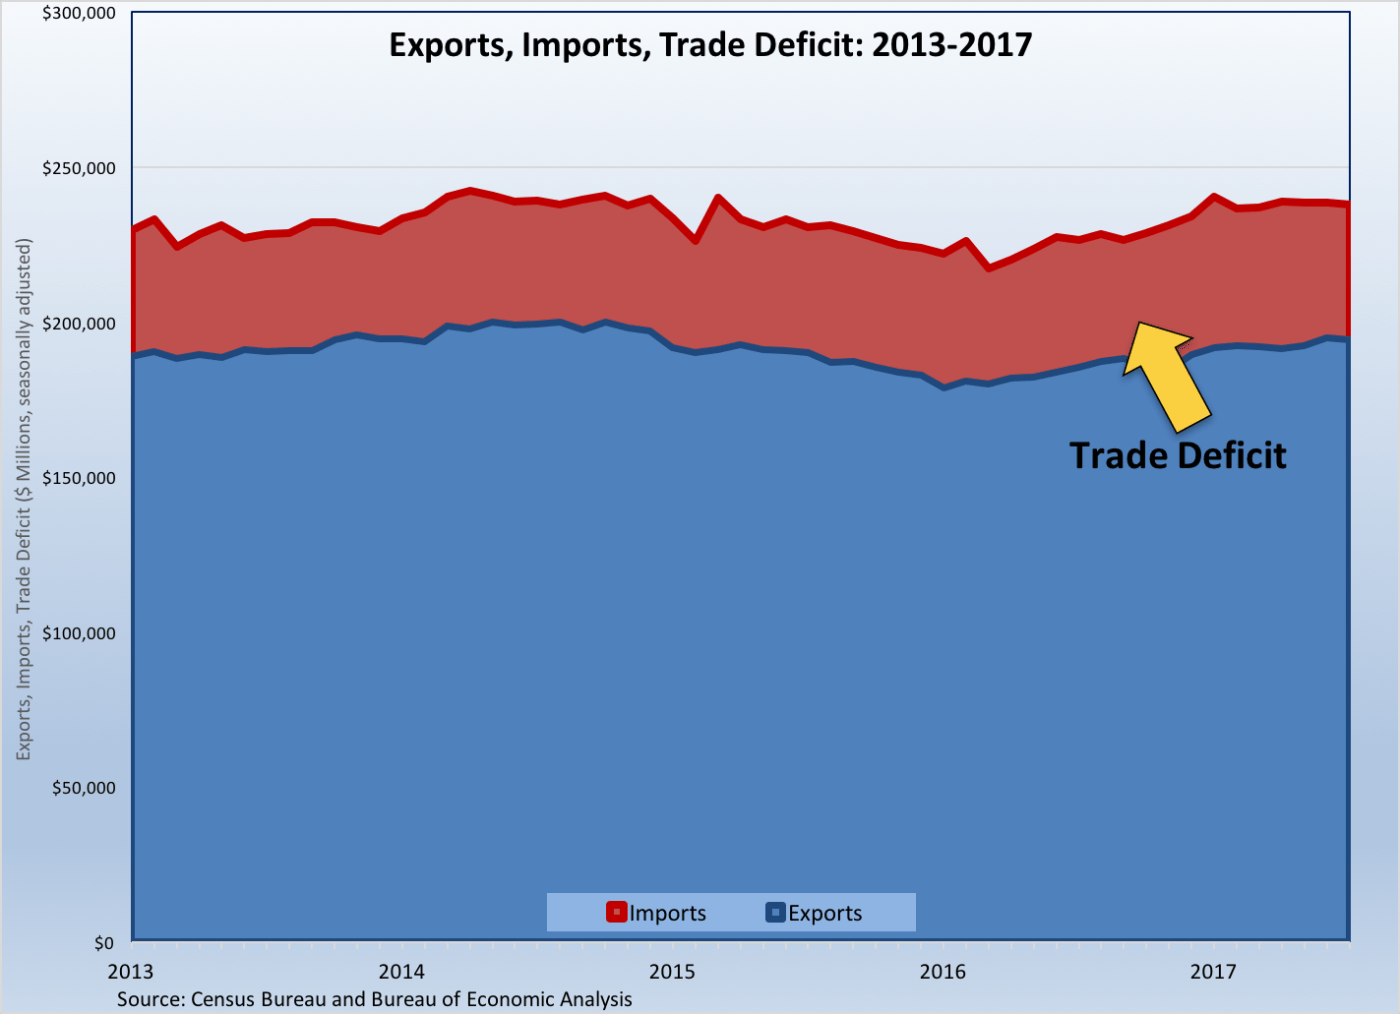
 The trade deficit held steady during July. The Census Bureau and Bureau of Economic Analysis tell us that exports slowed $0.6 billion to a seasonally adjusted $194.4 billion (+4.9 percent versus July 2016) and that import activity slipped by $0.4 billion to $238.4 billion (+5.1 percent versus 2016). The resulting trade deficit of $43.7 billion was up a mere $0.1 billion from June but was up 5.8 percent from a year earlier. The goods deficit was essentially unchanged at -$65.3 billion while the services surplus shrank by $0.2 billion to +$21.6 billion. While civilian aircraft exports grew by $1.1 billion, exports slowed for consumer goods and automotive vehicles. Capital goods imports increased $1.3 billion (largely of computers and associated accessories) while imports of crude oil and passenger cars both declined. The United States had its largest goods trade deficits in July with China, the European Union, Japan, and Mexico.
 A slowdown in transportation goods pulled down factory orders during July. Per the Census Bureau, new orders for manufactured goods fell 3.3 percent during the month to a seasonally adjusted $466.4 billion. Transportation goods orders plummeted 19.2 percent, thanks to a 70.8 percent drop in orders for manufactured goods and a 0.9 percent decline in orders for automobiles. Net of transportation goods, core factory orders gained 0.5 percent during July to a seasonally adjusted $392.2 billion. Growing during the month were new orders for electrical equipment/appliances (+2.6 percent), computers/electronics (+2.1 percent), furniture (+1.9 percent), fabricated metal products (+0.5 percent), nondurable goods (+0.4 percent), and primary metals (+0.2 percent). Shipments grew 0.3 percent during July, with shipments of non-transportation goods increasing 0.4 percent. Unfilled orders contracted 0.3 percent while inventories expanded 0.2 percent.
 Business activity in the service sector picked up during August. The headline index from the Institute for Supply Management’s Non-Manufacturing Report on Business grew by 1.4 points during to a seasonally adjusted reading of 55.3, regaining some of the measure’s losses from July. The NMI has been above a reading of 50.0—indicative of an expanding service sector—for 92 straight months. Three of the NMI’s four components improved during the month: business activity, new orders, and employment. The component for supplier deliveries declined during the month. Fifteen of 18 tracked service sector industries reported growth during the month, led by retail, information, and management of companies/support services. The press released noted that a “majority of respondents are optimistic about business conditions going forward.”
 Q2 productivity growth was a bit better than previously believed. The Bureau of Labor Statistics upwardly revised its estimate of nonfarm business sector productivity growth from the 0.9 percent gain reported a month ago to a 1.5 percent increase, with output growing 4.0 percent and the number of hours worked rising 2.5 percent. Productivity gains have varied greatly quarter-to-quarter and, as a result, output per hour worked has increased by only 1.3 percent over the past year. Manufacturing sector productivity rose 2.9 percent during the quarter (up from the 2.5 percent previously reported), led by a 3.8 percent bump in output per hour for durable goods (this was unchanged from the initial estimate released a month ago). Nondurable goods production increased 0.5 percent during Q2, an improvement from the original estimate of a 0.1 percent contraction.
 Hurricane Harvey led to a surge in jobless claims during the final days of August. The Department of Labor estimates that there were a seasonally adjusted 298,000 first time claims made for unemployment insurance benefits during the week ending September 2. This was up 62,000 from the previous week and 41,000 claims from the same week a year earlier. The state of Texas—site of Harvey’s prolonged landfall—suffered from 63,742 first time claims, up a sharp 51,637 claims from the previous week. The state with the second largest biggest week-to-week increase in first-time claims was Michigan, which saw its first-time claims count grow by a mere 3,283. The boost in unemployment resulting from Harvey is expected to be fleeting, but of course, Hurricane Irma will have similar (if also likely temporary) negative impact on the labor market over the coming weeks. Even with the surge in first-time claims, the four-week moving average of first-time claims of 250,250 was still down 3.6 percent from the moving average of the same week a year earlier.
Other U.S. economic data released over the past week:
– Consumer Credit (July 2017, Outstanding Consumer Credit Balances-net of real-estate backed loans, seasonally adjusted): $3.754 trillion (+$18.5 billion vs. June 2017, +5.9% vs. July 2016).
– Wholesale Inventories (July 2017, Inventories of Merchant Wholesalers, seasonally adjusted): $602.4 billion (+0.6% vs. June 2017, +3.3% vs. July 2016).
– Beige Book
The opinions expressed here are not necessarily those of Kevin’s current and previous employers. No endorsements are implied.
