
Retail sales continued to build momentum this fall, while gains in manufacturing were restrained. Here are the 5 things we learned from U.S. economic data released during the week ending November 18.
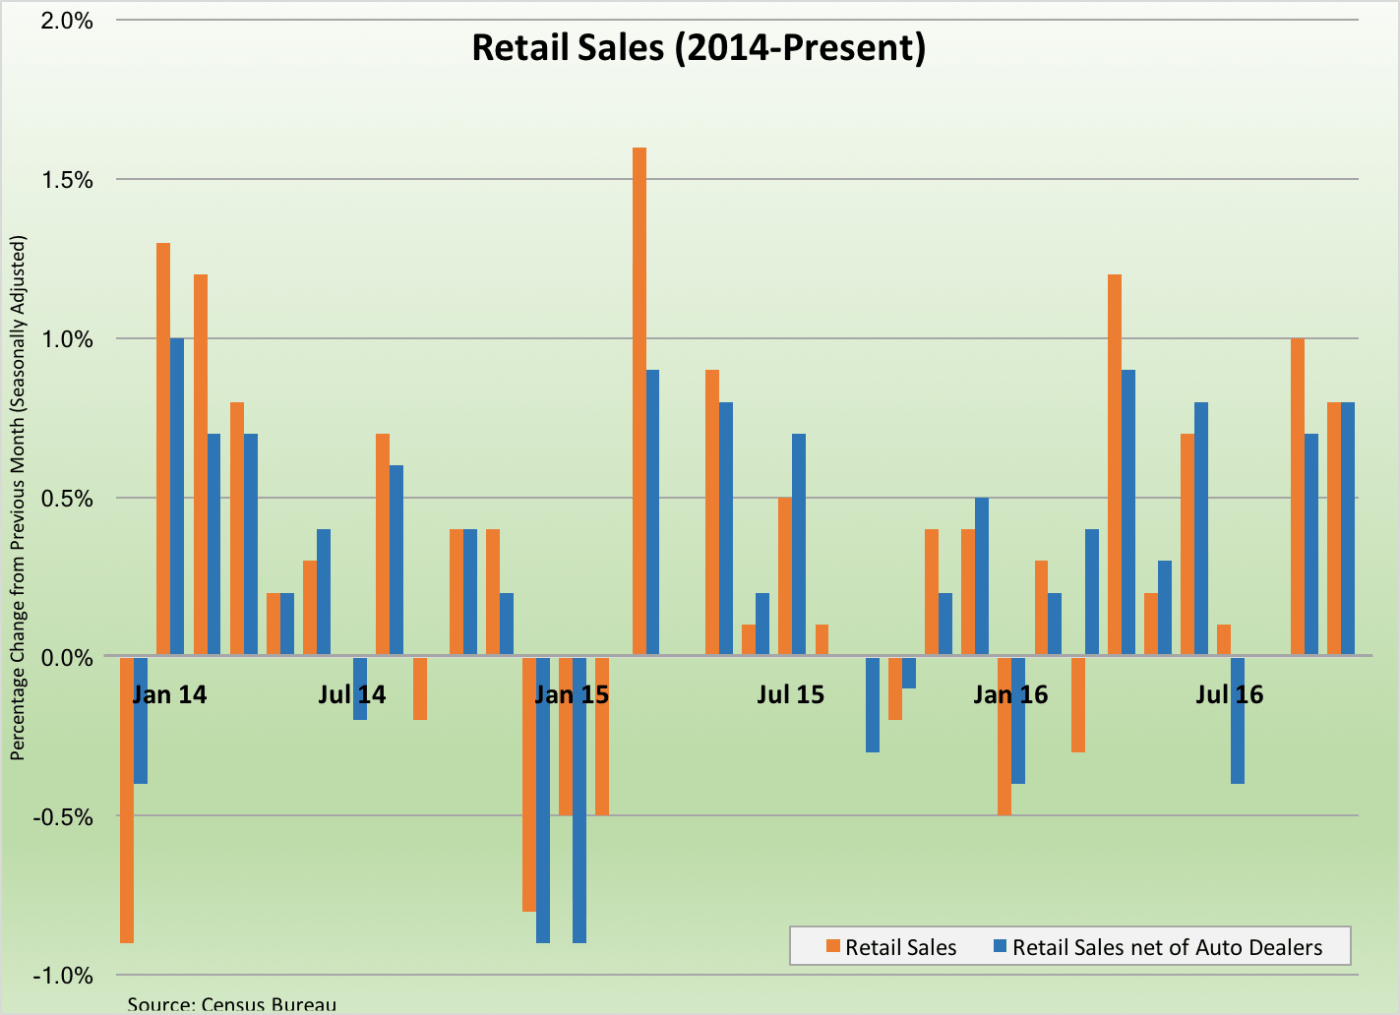
 Retail sales were strong again in October. The Census Bureau places its estimate of retail sales at a seasonally adjusted $465.9 billion, up 0.8% for the month and 4.3% from the same month a year earlier. Some of the gain reflected higher sales at both auto dealers (+1.1%) and gas stations (+2.2%, because of higher gas prices). But even net of sales at auto dealers & parts store, retail sales grew 0.8% during October and were 4.0% above year ago levels. Sales increased at sporting goods/hobby retailers (+1.3%), building materials stores (+1.1%), health care/personal care stores (+0.8%), grocery stores (+0.7%), and apparel retailers (+0.6%). Sales slowed at furniture retailers (-0.9%), department stores (-0.7%), and at restaurants/bars (-0.7%). Sales at nonstore retailers (e.g., internet retailers) jumped 1.5% during the month and were 12.9% above October 2015 levels.
 Manufacturing output increased modestly during October. The Federal Reserve estimates manufacturing production grew 0.2% during the month, matching September’s increase but leaving factory output 0.2% below that of a year earlier. Production of durable goods gained 0.4%, with most product types seeing an increase during the month. Auto production expanded for a 5th straight month and was approximately 7.5% above production levels of a year earlier. Nondurables output was unchanged, which included a 0.4% increase in the output of chemicals and a 0.8% drop off in paper production. Overall industrial production was unchanged from September, putting it 0.9% below year ago levels. Utility output slowed 2.6% during October while mining output gained 2.1% Capacity utilization slipped 1/10th of a point to 75.3% (it was at 76.3% during the same month a year ago). Capacity utilization in the manufacturing sector inched up 1/10th of a percentage point to 74.9%. A year earlier, the same measure was at 75.6%.
 Higher gasoline prices pull up consumer prices while the impact on wholesale prices was muted. According to the Bureau of Labor Statistics, Consumer Price Index (CPI)) jumped 0.4% on a seasonally adjusted basis during the month, its largest single-month gain since April. Energy CPI surged 3.5% during October (following a 2.9% jump during the previous month) with large increases in the prices for gasoline (+7.0%), fuel oil (+5.9%), utility delivered natural gas (+0.9%), and electricity (+0.4%). Energy CPI was 0.1% above year ago levels, although gasoline prices remained 0.9% below their October 2015 mark. Meanwhile, food prices held steady during the month and were 0.4% below year ago levels. Net of energy and food, core CPI increased by a modest 0.1% during the month, with the largest increases seen for shelter (+0.4%), apparel (+0.3%), and new vehicles (+0.2%). Prices declined for transportation services (-0.2%) and used vehicles (-0.1%). CPI has increased 1.6% over the past year while core CPI was 2.1% above its October 2015 level (essentially at the Fed’s interest target–although the Fed more closely other meaures of inflation).
The Producer Price Index for final demand was unchanged during October and was a mere 0.8% above year ago levels. Final demand PPI net of energy, food and trade slipped 0.1% during the month and had a 12-month comparable of +1.6%. Wholesale prices for final demand goods grew 0.4% during the month, pulled up by a 2.5% gain in energy PPI (gasoline PPI: +9.7%). Food PPI fell 0.8% while prices for final demand goods net of energy and food eked out a 0.1% bump up. Prices for final demand services dropped 0.3%, as the index for trade services—which tracks margins for wholesalers and retailers—fell 0.3%
 Homebuilder confidence remained firm in November. The National Association of Home Builders’ Housing Market Index was unchanged during the month, keeping it at a seasonally adjusted reading of 63. This was the 3rd straight month in which the measure of homebuilder sentiment was above a reading of 60. The index grew in 3 of 4 Census regions, while the HMI held steady in the South. Also unchanged during the month was the index measuring sales of new single-family homes (at 69) while the index for expected sales over the next 6 months shed 2 points to 69. The traffic for prospective buyers index added a point to 47. The press release noted that “[o]ngoing job creation, rising incomes and attractive mortgage rates are supporting demand in the single-family housing sector. This will help keep housing on a steady, upward glide path in the months ahead.”
 Leading indicators suggest a small gain in economic activity during October. The Conference Board’s Leading Economic Index (LEI) grew by 1/10th of a point to 124.5 (2010=100), its 2nd straight monthly increase and its 4th gain over the past 5 months. 6 of 10 LEI components made a positive contribution to the index, led by the interest rate spread, average weekly manufacturing hours worked, and nondefense capital goods orders (net of aircraft). Also adding 1/10th of a point was the coincident index (to 114.3). All 4 components of the measure made a positive contribution to the index, led by nonfarm payrolls and personal income net of transfer payments. The lagging index added 3/10ths of a point to 122.9, with 3 of 7 index components making a positive contribution. Even though all 3 indices had small increases, the press release declares that “the economy will continue expanding into early 2017.”
Other data released over the past week that you might find of interest:
– Jobless Claims (week ending November 12, 2016, First-Time Claims, seasonally adjusted): 235,000 (-19,000 vs. previous week; -40,000 vs. the same week a year earlier). 4-week moving average: 253,500 (-7.3% vs. the same week a year earlier).
– Housing Starts (October 2016, seasonally adjusted): 1.323 million (+25.5% vs. September 2016, +23.3% vs. October 2015).
– Manufacturing/Trade Inventories (September 2016, seasonally adjusted): $1.819 trillion (+0.1% vs. August 2016, +0.6% vs. September 2015).
– Regional and State Employment (October 2016, Nonfarm Payrolls, seasonally adjusted): Vs. September 2016: increased in 11 states, decreased in 5 states and essentially unchanged in 34 states and District of Columbia. Vs. October 2015: increased in 31 states and the District of Columbia, declined in 2 states and held steady in 17 states.
– Treasury International Capital Flows (September 2016, Domestic Securities Purchased by Foreign Investors, not seasonally adjusted): -$46.6 billion (August 2016: +$27.5 billion, September 2015: +$5.5 billion).
The opinions expressed here are not necessarily those of Kevin’s current and previous employers. No endorsements are implied.
