

Employers added jobs at a moderate pace during September. Here are the 5 things we learned from U.S. economic data released during the week ending October 7.
 Job creation was at a solid but not spectacular pace during September. Nonfarm employers added 156,000 jobs on a seasonally adjusted basis during the month, according to the Bureau of Labor Statistics. In the same report, the BLS downwardly revised its July estimate of job creation by 23,000 to +252,000 but added 16,000 jobs to its August payroll estimate to +167,000. Private sector employers expanded their payrolls by 167,000 jobs during September, split between 10,000 new jobs in the goods producing side of the economy and 157,000 new jobs in the service sector. Industry sectors with the most added jobs included financial services (+67,000), temporary help services (+29,000), construction (+23,000), retail (+22,000), and health care/social assistance (+21,800). The average weekly hours worked crept up by 1/10th of an hour to 34.4 hours while average weekly earnings were at $887.18 (+2.3% vs. September 2015).
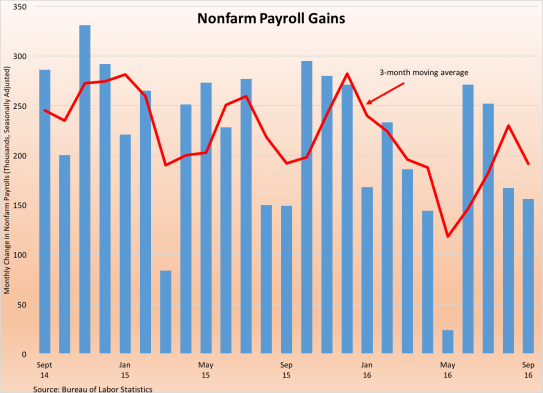
A separate survey of households puts the unemployment rate at 5.0%, up 1/10th of a percentage point from August. A huge 444,000 adults entered the labor force during the month while the labor force participation rate added 1/10th of a percentage point to 62.9%. The typical unemployed person had been out of work for 10.3 weeks, down 9/10ths of a week from August and a full week from a year earlier. 5.894 million people held part-time jobs but were seeking a full-time opportunity, down 159,000 from August and 140,000 from September 2015. The broadest measure of labor underutilization from the BLS (the U-6 series) held steady during the month at 9.7%. A year ago, the same measure was at 10.0%.
 The trade deficit widened slightly during August. The Census Bureau and Bureau of Economic Analysis reports that exports grew $1.5 billion to $187.9 billion (+0.7% vs. August 2015) while imports increased $2.6 billion to $228.6 billion (-1.2% vs. August 2015). The resulting trade deficit of -$40.7 billion was $1.2 billion larger than that in July but down 8.8% from a year earlier. The goods deficit essentially held steady at -$60.3 billion (8.7% below the August 2015 deficit) while the services surplus shrank by $1.2 billion to +$19.6 billion (-8.5% vs. August 2015). The former reflected a $1.2 increase in exported goods (including gains in industrial supplies/materials and automobiles and a decline in civilian aircraft exports) and a $1.1 billion increase in goods imports (including greater imports of capital goods). The U.S. had its largest goods trade deficits with China, European Union, Japan, Germany, and Mexico.
 August featured a small increase in factory orders. The Census Bureau reports new orders for manufactured goods grew 0.2% during the month to a seasonally adjusted $453.1 billion (-1.6% vs. August 2015). Orders for transportation goods increased 0.7% despite a 22.7% decline in civilian aircraft orders. Growing were orders for motor vehicles (+0.7%) and defense aircraft (+26.9%). Net of transportation goods, new orders were unchanged during the month and were 1.6% below the year ago pace. Growing were orders for furniture (+3.5%) and primary metals (+0.4%) while orders for electrical equipment/appliances (-2.3%), computers/electronics (-0.6%), machinery (-0.4%), and fabricated metals (-0.3%) all declined. A measure of business investment (nondefense capital goods net of aircraft) increased 0.9% during the month. Shipments increased for the 5th time over the past 6 months albeit with a less than 0.1% gain to $458.1 billion (-2.0% vs. August 2015). The value of unfilled orders contracted for a 3rd consecutive month (-0.1% to $1.123 trillion) while inventories expanded 0.2% to $622.0 billion.
 Manufacturing and service sector activity grew in September. The Purchasing Managers Index (PMI) bounced back from a drop in August with a 2.1 point gain in September to 51.5, according to the Institute for Supply Management. This was the PMI’s return to an above 50.0 reading, indicative of an expanding manufacturing sector. 4 of 5 PMI components improved during the month: new orders (+6.0 points to 55.1), production (+3.2 points to 52.8), employment (+1.4 points to 49.7), and inventories (1/2 point to 49.5). The supplier deliveries index shed 6/10ths of a point to 50.3. Just seven of the 18 tracked manufacturing segments expanded during the month, led by nonmetallic mineral products, furniture, and textile mills. ISM’s report also indicates that the PMI reading of 51.5 PMI is consistent with economic expansion at a 2.6% annualized growth rate.
Meanwhile, the headline index from ISM’s nonmanufacturing Report on Business hit its highest reading in 11 months with a 5.7 gain to 57.1. This was the measure’s 80th straight month above the expansion/contraction threshold of 50.0. All four index components—business activity, new orders, employment, and supplier deliveries— had readings above 50.0, but the supplier deliveries measure slipped from its August mark. 14 of 18 tracked service sector industries enjoyed growth during September, led by agricultural/fishing/hunting, utilities, and retail. The press release noted that comments from survey participants were “largely positive” but noted “[a] degree of uncertainty does exist due to geopolitical conditions coupled with the upcoming U.S. presidential election.”
 Vehicle sales picked back up in September but remained below their year ago pace. Autodata’s estimate of vehicle sales grew 4.5% during the month to a seasonally adjusted annualized rate of 17.76 million units. This was 2nd to only July as the best month for vehicle sales in 2016 based on the SAAR. Sales were off 1.6% from the September 2015 pace, but still among the strongest readings seen post recession. Sales of automobiles gained 6.9% during the month to a SAAR of 7.24 million cars, its best reading since February. Meanwhile, sales of light trucks/SUVs increased 2.9% during the month to 10.51 million units (SAAR). This was 3.6% above its year ago sales rate.
Other data released over the past week that you might find of interest:
– Jobless Claims (week ending October 1, 2016, First-Time Claims, seasonally adjusted): 249,000 (-5,000 vs. previous week; -18,000 vs. the same week a year earlier). 4-week moving average: 258,500 (-6.6% vs. the same week a year earlier).
– Construction Spending (August, 2016, Value of Construction Put Into Place, seasonally adjusted annualized rate): $1.142 trillion (-0.7% vs. July 2016, -0.3% vs. August 2015).
– Consumer Credit (August 2016, Outstanding Credit Balances (net of real estate backed loans), seasonally adjusted): $3.687 trillion (+$25.8 billion vs. July 2016, +6.3% vs. August 2015).
The opinions expressed here are not necessarily those of Kevin’s current and previous employers. No endorsements are implied.
