
A series of economic data released last week finds moderate economic growth during the tail end of Q2. Here are the 5 things we learned from U.S. economic data released during the week ending July 22.
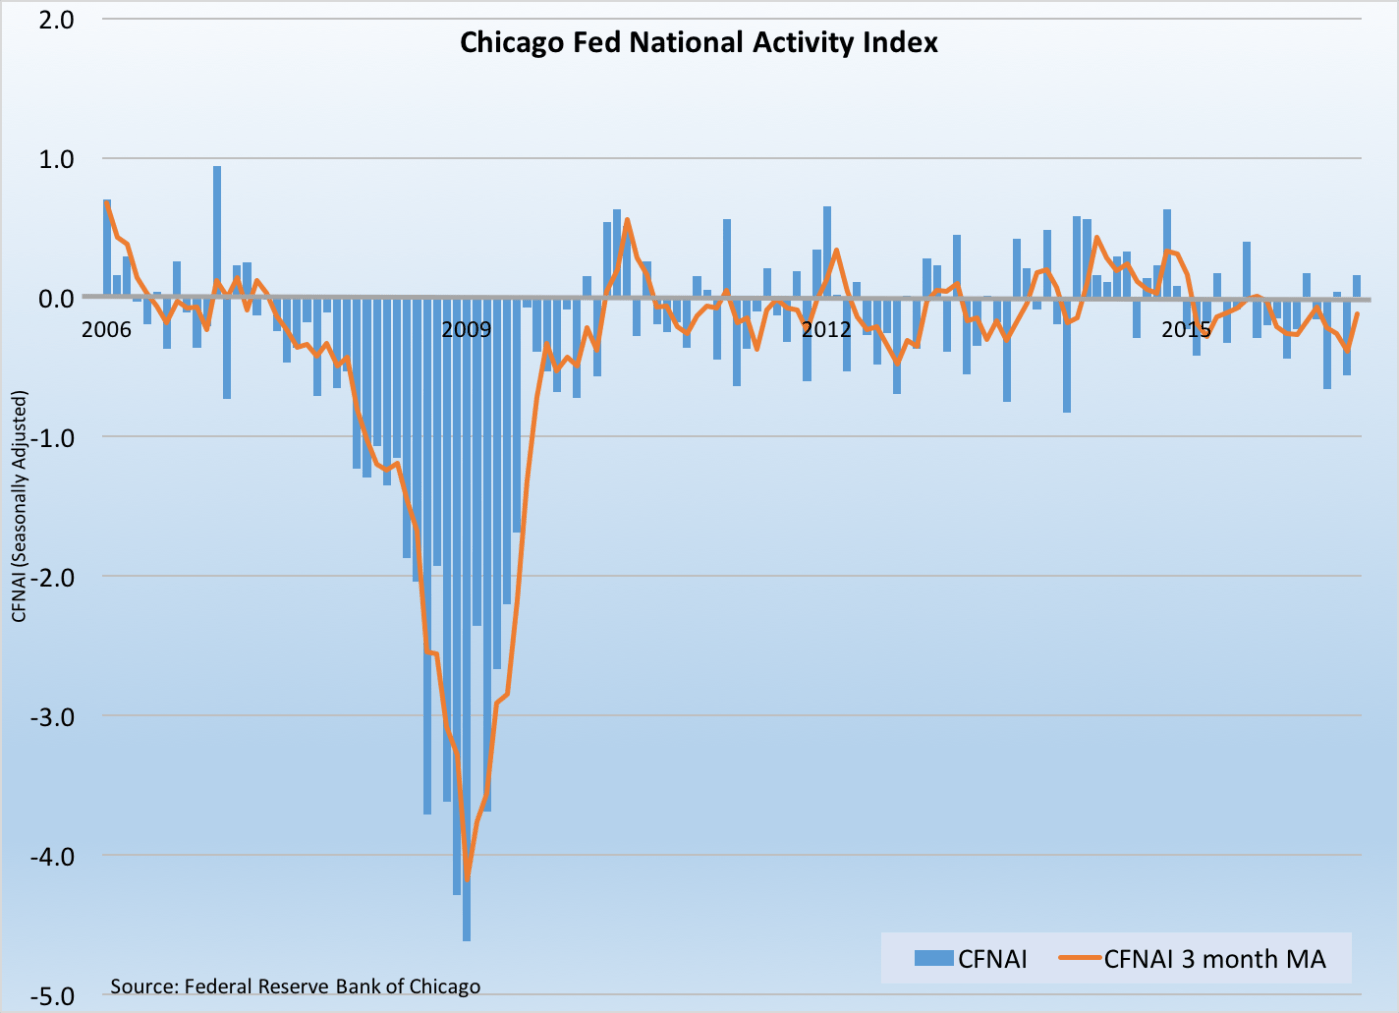
 Economic activity expanded in June. The Chicago Fed National Activity Index (CFNAI) jumped 72-basis points to a seasonally adjusted reading of +0.16. This was only the 2nd time this year in which the economic activity measure based on 85 indicators as tracked by the Federal Reserve Bank of Chicago was in positive territory. 3 of 4 major categories of index components improved during the month, led by those dealing with production/income, employment, and sales/orders. Also improving was the CFNAI’s 3-month moving average, as it gained by 27-basis points to -0.12. While this 17th time over the past 18 months in which the moving average was negative (indicative of below average but still positive economic growth), this was its best reading since February.
 A measure of leading economic indicators also perked up in June. The Conference Board’s Leading Economic Index gained 3/10ths of a point during the month to 123.7 (2010=100). This was only the 2nd increase in 8 months for the measure. 8 of the LEI’s 10 components improved during the month, led by initial jobless claims and the interest rate spread. The coincident index also added 3/10ths of a point during June, rising to a reading of 113.8. All 4 index components improved during the month, including nonagricultural payrolls and industrial production. Finally, the lagging index slipped 1/10th of a point to 121.9, with only 3 of 7 index components advancing. The press release stated that the leading index remains consistent with “moderating economic growth,” but nevertheless the “expansion still appears resilient enough to weather volatility in financial markets and a moderating outlook in labor markets.”
 June was the best month for existing home sales since February 2007. The National Association of Realtors estimates sales of previously owned homes were at a seasonally adjusted annualized rate of 5.57 million units. This was up 1.1% from May 2016 and 3.0% from a year earlier. Sales grew in the Midwest (+3.8%) and West (+1.7%), held steady in the South but slowed 1.3% in the Northeast. Inventories of previously owned homes shrank 0.9% during June to 2.12 million units (-5.8% vs. June 2015). The resulting tight 4.6 month supply promoted a 4.8% year-to-year gain in the median sales price to $247,700. NAR’s press release also noted that the percentage of homes purchased by first-time buyers hit a 4 year high at 33% while the share of purchases by investors dropped to its lowest point since July 2009 at 11%.
 While gaining during June, housing starts remained mired within a tight range. The Census Bureau’s housing starts estimate of 1.189 million units (seasonally adjusted annualized rate) was up 4.8% for the month but off 2.0% from a year earlier. Over the past year, the rate of housing starts has stayed with a range between 1.073 million and 1.214 million units. Starts of single-family home units gained 4.4% to 778,000 units (+13.4% vs. June 2015) while the multi-family rate gained 5.4% to 411,000 units (-22.0% vs. June 2015). Looking towards future activity, there were 1.153 million issued permits (SAAR), up 1.5% from May 2016 but -13.5% below year ago levels. The rate of issued permits for single-family homes edged up 1.0% to 738,000 (+5.1% vs. June 2015) while that for multi-family units gained 2.5% to 415,000 (-34.3% vs. June 2015. Completions jumped 12.3% during June to 1.147 million units (SAAR). This was 18.7% above year ago levels.
 Homebuilder confidence remained solid in July. The National Association of Home Builders’ Housing Market Index (HMI) slipped by a point during the month to a seasonally adjusted 59. This was the 25th straight month in which the HMI was above a reading of 50 (meaning more builders describe the housing market as “good” than describe it as “poor”) with every reading since June 2015 being at or above 58. The index improved in 3 of 4 Census regions (Northeast, Midwest, and West), but lost ground in the South. Also moving backward were measures of current sales (down a point to 63) and expected sales of single-family homes (down 3 points to 66) along with the prospective buyers traffic index (off a point to 45). While the press release expressed expectations “for continued slow, steady growth in the housing market,” it noted that some homebuilders reported “scatter softness in some markets, due largely to regulatory constraints and shorts of lots and labor.”
Other data released over the past week that you might find of interest:
– Jobless Claims (week ending July 16, 2016, First-Time Claims, seasonally adjusted): 253,000 (-1,000 vs. previous week; -10,000 vs. the same week a year earlier). 4-week moving average: 264,750 (-7.3% vs. the same week a year earlier).
– Treasury International Capital Flows (May 2016, Net Foreign Purchases of U.S. Securities): +$11.5 billion (vs. April 2016: -$53.5 billion, vs. +$82.0 billion).
–FHFA Home Price Index (May 2016, Purchase Only Index, seasonally adjusted): +0.2% vs. April 2016, +5.6% vs. May 2015.
– Regional and State Employment (June 2016, seasonally adjusted): Nonfarm payrolls grew vs. May 2016 in 18 states, decreased in 3 states & District of Columbia, and was essentially unchanged in 29 states. Payrolls grew over the past 12 months in 35 states, declined in 2 states, and were essentially unchanged in 13 states & District of Columbia.
The opinions expressed here are not necessarily those of Kevin’s current and previous employers. No endorsements are implied.
