
Ok, the first estimate of Q2 economic growth was not “decent” after all. Actually, the word “disappointing” is more appropriate. Here are the 5 things we learned from U.S. economic data released during the week ending July 29.
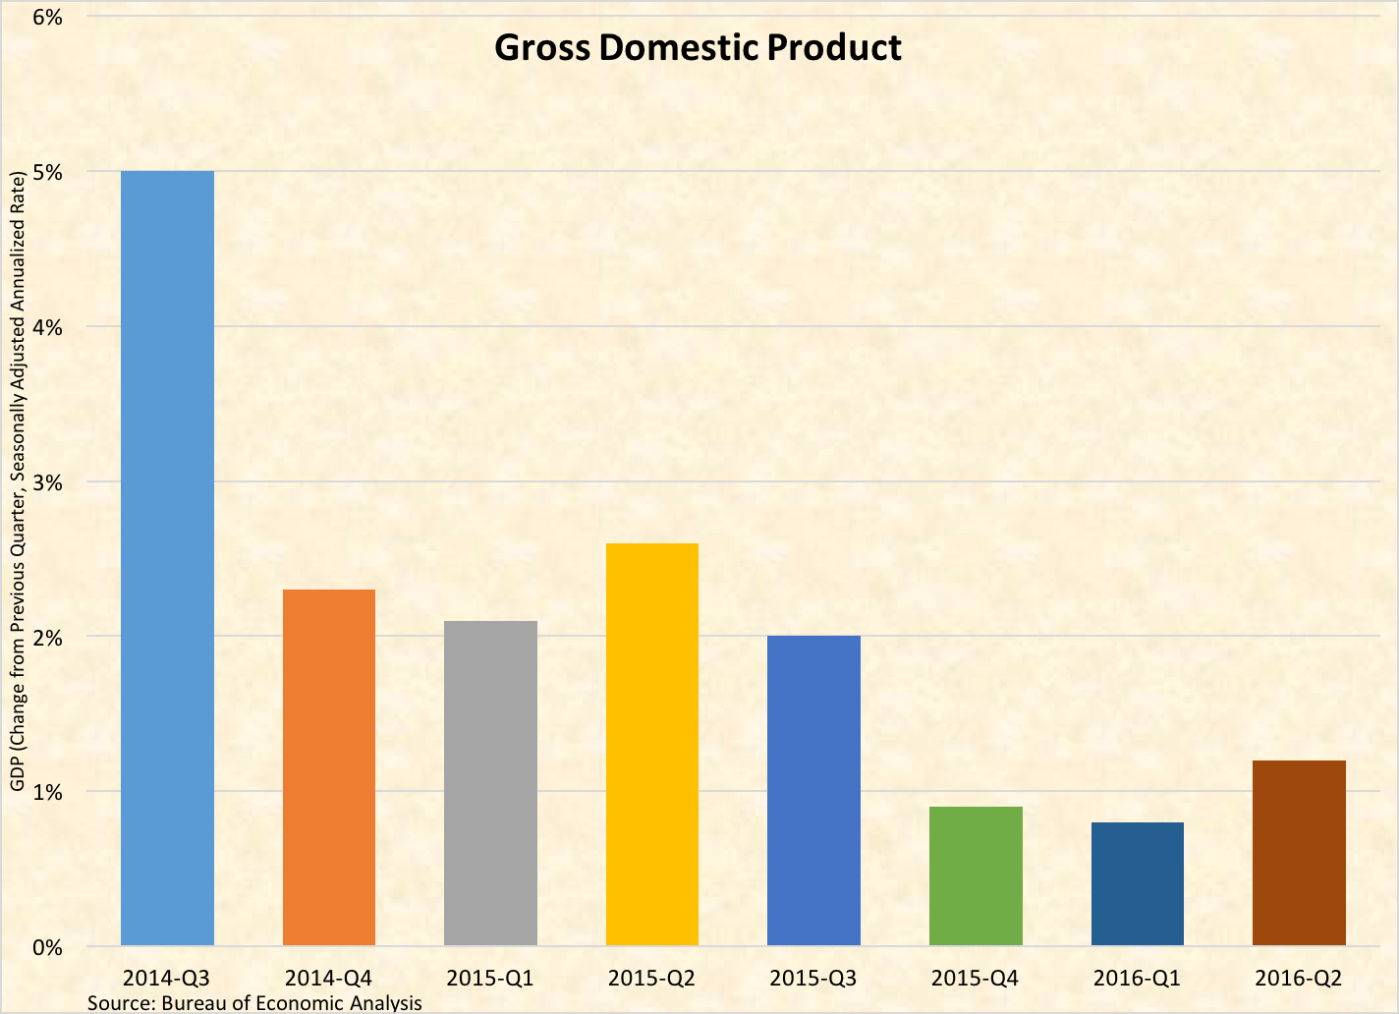
 The U.S. economy grew at a far slower pace during Q2 than expected. The Gross Domestic Product (GDP) estimate from the Bureau of Economic Analysis showed only a 1.2% gain on a seasonally adjusted annualized basis. This was well below consensus forecast that had expected a gain in the range of 2.0% and 2.5% for the months of April, May, and June. Even worse, the BEA lowered its estimates for Q1 2016 and Q4 2015 economic expansion to just +0.8% and +0.9%, respectively. The weak Q2 report occurred despite consumption growing at its fastest pace in 6 quarters (+4.2%, SAAR). Also making a positive contribution to GDP growth was net exports, with exports increasing 1.4% and imports slowing 0.4%. Drags on GDP growth included fixed investment (residential: -6.1%, nonresidential: -2.2%) and government expenditures (-0.9%). Further, the tepid pace of private inventory accumulation of “just” $18.4 billion cost 116-basis points in GDP growth just by itself. Private inventory accumulation has been a drag on GDP growth for the past 5 consecutive quarters. The BEA will update its Q2 GDP report twice over the next 2 months.
 The Fed decides to not make a move, but once again opens the door for a possible rate hike later this year. The policy statement released following the conclusion of the Federal Open Market Committee meeting noted that the U.S. economy was growing “at a moderate rate” and that the labor market had “strengthened,” with signs that there had been “some increase in labor utilization.” Household spending was growing, but business spending was “soft” and inflation remained below the Fed’s 2% target (although this was largely because of previous declines in energy prices). As a result, the FOMC voted to maintain the .25%-.50%, which the statement described as “accommodative, thereby supporting further improvement in labor market conditions and a return to 2 percent inflation.” The statement stressed that the downside risks to the economy had “diminished” and that it Fed expects inflation to move closer to its 2% target as energy and import prices firm and the “labor market strengthens further.” (Note that the FOMC policy statement was released on Wednesday, 2 days before the release of the disappointing GDP report referenced above.)
 Durable goods sputtered gain in June. The Census Bureau reports that new orders for durable goods slumped 4.0% during the month to a seasonally adjusted $219.8 billion (-6.4% vs. June 2015). A major culprit was the typically volatile aircraft segments: civilian aircraft orders plummeted 58.8% while defense aircraft orders slowed 7.4%. Those declines were only marginally counterbalanced by a 2.6% bump up in motor vehicles orders. Net of transportation goods, new orders dropped 0.5% during the month and were 3.6% below the year ago pace. Most other durable goods categories suffered from declining new orders; including, computers/electronics (-2.2%), primary metals (-1.3%), and fabricated metal products (-0.3%). One bright spot was a 0.8% increase in orders for electrical equipment/appliances. Meanwhile, shipments of durable goods grew for the 2nd time in 3 months with a 0.4% increase to $235.5 billion (-2.0% vs. June 2015). Net of transportation goods, durable goods shipments slipped 0.2% for the month and were 3.2% below the year ago pace.
 On the heels of last week’s existing home sales report, new home sales hit an 8-year high in June. The Census Bureau reports that the seasonally adjusted annualized sales pace for new home sales of 592,000 was up 3.5% from May, 25.4% from a year earlier and the highest reading since February 2008. Sales grew during June in the West (+10.9%), and Midwest (+10.4%), but slowed in the Northeast (-5.6%) and South (-0.3%). All 4 Census regions had positive double-digit percentage gains versus their June 2015 paces. While inventories of unsold homes remained at a tight 4.9 month supply, the 244,000 new homes available for sale at the end of June was up 1.2% from May 2016 and 13.0% from June 2015. The median sales price of $306,700 was 6.1% above year ago levels.
 One measure of consumer sentiment was essentially flat in July, another one fell. The Conference Board Consumer Confidence Index slipped by 1/10th of a point to a seasonally adjusted 97.3 (1985=100). The present conditions index added 1.7 points to 118.3 (its best reading in 10 months) while the expectations index lost 1.3 points to 83.3. 28.1% of survey respondents described current business conditions as “good” while 19.0% said that they were “bad.” Nearly matching were the percentages of consumers who agreed that jobs were either “plentiful” (23.0%) and “hard to get” (22.3%). The press release stated that the results “[suggest] will continue to expand at a moderate pace.”
More glum were the results from the University of Michigan Index of Consumer Sentiment, which shed 3.5 points in July to a seasonally adjusted 90.0 (1966Q1=100). While this was the measure’s lowest reading since April, it represented a half point improvement from the preliminary July reading reported a few weeks ago. Indices for both current and expected conditions, with the former off 1.8 points to 109.0 and the latter down 4.6 points to 77.8. The press release suggests that drop in sentiment was the product of “uncertainties surrounding global economic prospects and the presidential election.”
Other data released over the past week that you might find of interest:
– Jobless Claims (week ending July 23, 2016, First-Time Claims, seasonally adjusted): 266,000 (+14,000 vs. previous week; -3,000 vs. the same week a year earlier). 4-week moving average: 256,500 (-6.8% vs. the same week a year earlier).
– Pending Home Sales (June 2016, Index (2001=100), seasonally adjusted): 111.0 (+0.2% vs. May 2016, +1.0% vs. June 2015).
– Case-Shiller Home Price Index (May 2016, 20-City Index, seasonally adjusted): -0.1% vs. April 2016, +5.2% vs. May 2015.
– Agricultural Prices (June 2016, Prices Received by Farmers, seasonally adjusted): -1.4% vs. May 2016, -10.6% vs. June 2015.
– Bankruptcy Filings (12-month period ending June 30 2015): 819,159 (-6.9% vs 12-month period ending June 30, 2015). Business filings: 25,277 (+0.7% vs. 12-month period ending June 30, 2015). Nonbusiness filings: 793,932 (-7.1% vs. 12-month period ending June 30, 2015).
The opinions expressed here are not necessarily those of Kevin’s current and previous employers. No endorsements are implied.
