

The July employment report was a bit of an antidote to the disappointing Q2 GDP data released a week earlier. Surveys of purchasing managers and data on construction spending did not provide additional relief. Here are the 5 things we learned from U.S. economic data released during the week ending August 5.
 Employers are continuing to add workers this summer. The Bureau of Labor Statistics estimates nonfarm payrolls expanded by a seasonally adjusted 255,000 jobs during July, the largest single-month gain since last December. After including the impact of a combined 18,000 jobs added to previously reported job estimates for May and June, you get a 3-month job gain of 190,333. This was the 3-month moving average’s highest point since March, but still below the averages seen in all of 2014 and 2015. Government employers added 38,000 jobs during the month while private sector payrolls expanded by 217,000. Industries adding the most workers during July included professional/business services (+70,000), health care/social assistance (48,800), leisure/hospitality (+45,000), financial services (+18,000), retail (+14,700), and construction (+14,000). The average number of hours worked inched up 1/10th of an hour to 34.5 hours (July 2015: 34.6) while average hourly earnings added 8 cents to $25.69 (+2.6% vs. July 2015). Average weekly earnings of $886.31 were up 2.3% from the same month a year earlier.
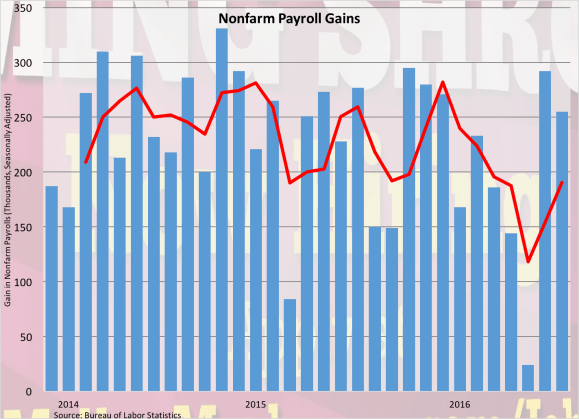
A separate survey of households keeps the unemployment rate unchanged for the month at 4.9% (July 2015: 5.3%). 407,000 people entered the labor force during the month, resulting in a 1/10th of a percent point increase in the labor force participation rate to 62.8%. This remains well below pre-recession levels and near an almost 4-decade low. The number of “involuntary” part-time workers grew by 97,000 to 5.940 million (-5.7% vs. July 2015) while the median length of unemployment bounced up 1.3 weeks to 11.6 weeks (July 2015: 11.4 weeks). Finally, while the broadest measure of labor underutilization from the BLS (the U-6 series) increased by 1/10th of a percentage point to 9.7%, this was down from 10.4% a year earlier and from its peak during the last recession of 17.1% (April 2010).
 “Real” personal spending increased for a 3rd straight month. The Bureau of Economic Analysis places its estimate of real personal consumption expenditures (PCE) (based on 2009 chained dollars) at $11.514 trillion. This was up 0.3% for the month and 2.8% from a year earlier. Spending on goods and services also each grew at a 0.3% pace, with 12-month comparables for both at +3.6% and +2.4%, respectively. Durable goods spending gained 0.4% while that for nondurables increased 0.3%. Without adjustments for price variations, nominal consumer spending increased 0.4% during June.
The increased spending was funded, in part, by the 4th consecutive monthly rise in nominal personal income (+0.2% vs. May 2016, +2.7% vs. June 2015). Nominal and real disposable income grew 0.2% and 0.1%, respectively, during the month and expanded 3.1% and 2.2%, respectively, over the past 12 months. Also funding the growth in spending was a decline in savings. The savings rate of +5.3% was down 2/10ths of a percentage point from May and a half point from a year earlier. Finally, the same report shows still a moderate level of inflation. The PCE deflator grew 0.1% and was up only 0.9% over the past year. Removing both energy and food from the analysis finds the core PCE deflator up 0.1% for the month with the 12-month comparable below the Federal Reserve’s 2-percent target at 1.6%.
 The trade deficit widened during June. The Census Bureau and the Bureau of Economic Analysis report that exports grew $0.7 billion to a seasonally adjusted $183.2 billion (-3.8% vs. June 2015) while imports expanded $3.2 billion to $227.7 billion (2.4% vs. June 2015). The resulting trade deficit of -$44.5 billion was up $3.6 billion for the month, 3.6% larger than that of a year earlier, and at its widest point since last August. The goods deficit expanded by $3.8 billion to $66.0 billion (+1.0% vs. June 2015) while the services surplus grew by $0.2 billion to +$21.5 billion (-3.9% vs. June 2015). The growth in the former was the result of higher imports for industrial supplies/materials (including crude oil), consumer goods (including pharmaceutical preparations and cell phones), and capital goods. Based on chained 2009 dollars, the “real” goods deficit grew by $3.8 billion to -$64.7 billion (+7.2% vs. June 2016). The U.S. had its largest goods deficits with China (-$28.0 billion), European Union (-$12.7 billion), and Japan (-$6.0 billion).
 Two surveys of purchasing managers suggest slower business growth in July. The Purchasing Managers Index (PMI) shed 6/10ths of a point to a seasonally adjusted reading of 52.6, according to the Institute for Supply Management. This was the 5th straight month in which the PMI was above 50.0, which means the manufacturing sector grew during the month but the decline in the PMI suggests slower growth. 2 of 5 index components improved during the month (production and inventories) while the other 3 declined (supplier deliveries, employment, and new orders). 11 of 18 manufacturing sectors expanded during the month, led by textile mills and printing.
Meanwhile, the ISM’s measure for the service sector declined by a full point to a seasonally adjusted 55.5. The index has been above 50.0—indicating service sector expansion—for 78 straight months. 3 of 4 index components fell versus their June readings: supplier deliveries, employment, and business activity. Only the index component for new orders improved during the month. 15 of 18 nonmanufacturing industry expanded during the month; including, arts/entertainment, education services, and accommodation/food services. ISM’s press release noted that survey participants’ comments “reflect stability and continued growth for their respective companies and a positive outlook on the economy.”
 Construction spending slowed for a 3rd straight month during June. The Census Bureau estimates the value of construction put into place during the month was at seasonally adjusted annualized rate (SAAR) of $1.134 trillion. This was down 0.6% from May but up 0.3% above year ago levels. Private sector construction spending also declined at a 0.6% rate during June to $856.6 billion (+2.5% vs. June 2015). Residential sector spending was unchanged for the month even as spending on new single-family and multifamily residential property fell 0.5% and 1.5%, respectively. Private construction spending dropped 1.3%, pulled down by lower spending in manufacturing, education, health care, commercial, and power. Public sector construction spending slumped 0.6% to $282.5 billion (-6.0% vs. June 2015).
Other data released over the past week that you might find of interest:
– Jobless Claims (week ending July 30, 2016, First-Time Claims, seasonally adjusted): 269,000 (+3,000 vs. previous week; -5,000 vs. the same week a year earlier). 4-week moving average: 260,250 (-4.0% vs. the same week a year earlier).
– Vehicle Sales (July 2016, seasonally adjusted annualized rate): 17.88 million (+6.8% vs. June 2016, +1.6% vs. July 2015)
– Factory Orders (June 2016, New Orders, seasonally adjusted): $447.4 billion (-1.5% vs. May 2016, -5.6% vs. June 2015).
The opinions expressed here are not necessarily those of Kevin’s current and previous employers. No endorsements are implied.
