
Relatively speaking, last week featured solid if not particularly spectacular data on both housing and manufacturing activity. Here are the 5 things we learned from U.S. economic data released during the week ending May 20.
 Home sales held near to post-recession highs in April. Sales of previously owned homes gained 1.7% during the month to a seasonally adjusted annualized rate (SAAR) of 5.45 million units. While sales were 6.0% above its year ago reading, the National Association of Realtors’ measure has consistently stayed in the low 5-million SAAR range for more than a year. For the month, sales jumped 12.1% in the Midwest and 2.8% in the Northwest, but slowed 2.7% in the South and 1.7% in the West. More owners are putting their properties on the market.
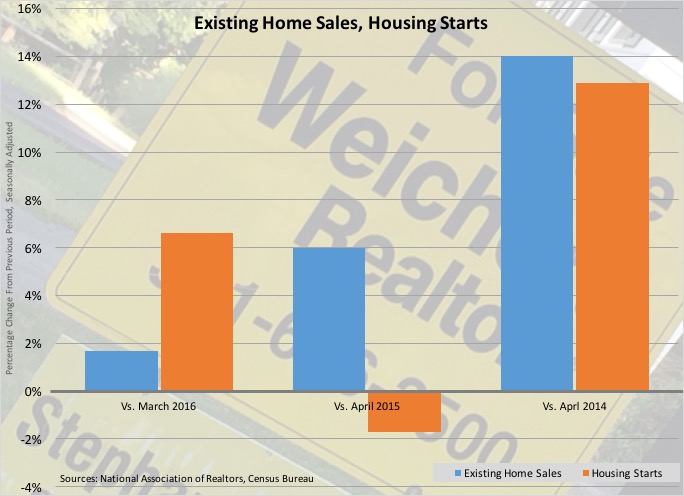
 There were a seasonally adjusted 2.14 million homes for sale at the end of April, up 9.2% from March and the most since last September. But even with the gain, this still translated into a tight 4.7 month supply. As a result, the median sales price of previously owned homes of $232,500 was up 6.3% from a year earlier. Because of the price appreciation, NAR’s press release warned that “there’s growing concern a number of buyers will be unable to find homes at affordable prices if wages don’t rise and price growth doesn’t slow.”
 Housing starts grow in April while home builder sentiment remains firm. The Census Bureau estimates April new home starts were at a seasonally adjusted annualized rate (SAAR) of 1.172 million units. While this was up 6.6% from March, it was off 1.7% from a year earlier with the data series remaining within a tight SAAR range of the low 1 million units since last spring. During the month, starts gained by double-digit percentages in both the Midwest and South, but chilled in the West and Northeast. Starts of single-family homes gained 3.3% while those for multi-family units jumped 13.9%. Looking forward, the count of issued construction permits increased 3.6% to a SAAR of 1.116 million units (-5.3% vs. April 2015). The SAAR of issued permits for single-family homes gained 1.5% during the month while those for multi-family units grew 8.0%. Softening was the SAAR of completed homes—at 933,000 units, it was off 11.0% for the month and 7.4% from the same month a year earlier.
Homebuilders remained confident about the housing market in May. The Housing Market Index from the National Association of Home Builders held steady a seasonally adjusted reading of 58 for a 4th straight month in May. For 23 straight months, the index has been above a reading of 50, which means more homebuilders view the housing market as “good” as opposed to being “poor.” The index gained in the Midwest (59) and South (60), held steady in the West (67) and fell in the Northeast (36). While the indices for present sales and the traffic of potential buyers were both unchanged (at readings of 63 and 44, respectively), the expected sales index added 3 points to 65. The press release stated that “job creation, low mortgage interest rates and pent-up demand will also spur growth in the single-family housing sector moving forward.”
 Manufacturing output gained in April. According to the Federal Reserve, manufacturing production increased 0.3% during the month but was up a mere 0.4% from a year earlier. All of the gain was for durable goods production, which grew 0.6% during April with strong gains for machinery (approximately +2.5%) and automobile production (approximately +1.25%). Nondurable goods production was unchanged for the month, even though output grew for food/beverages and plastics/rubber products. Overall industrial production expanded for only the 2nd time in 8 months with a 0.7% increase but remained 1.1% below output from the same month a year earlier. While utility output surged 5.8%, mining output contracted for an 8th consecutive month with a 2.3% decline. The latter reflected ongoing declines in the extraction of oil, natural gas and coal. While capacity utilization gained a ½ percentage point to 75.4%, this was 4.6 percentage points below its 44-year average. Manufacturing factory utilization inched up 2/10ths of a percentage point to 75.3%, which was 3.2 percentage points below its historic average.
 Consumer prices jumped in April and not only at the gas pump. The Bureau of Labor Statistics’ Consumer Price Index (CPI) grew a seasonally adjusted 0.4% during the month, its largest single-month increase since February 2013. Energy CPI jumped 3.4%, which includes an 8.1% bump in prices at the gas pump. Meanwhile, food prices gained 0.2%. Net of both energy and food, core CPI grew 0.2% during the month and was up 2.1% over the past year. Prices for core goods slipped 0.1%, pulled down by lower prices for apparel and both new and used vehicles (-0.3% for all three). Prices for core services gained 0.3%, which includes the impact of a 0.7% jump in transportation services prices (including higher prices for motor vehicle insurance and airplane tickets).
 Measures of current and leading economic indicators improved during April. The Chicago Fed National Activity Index (CFNAI), a weighted measure of 85 economic indicators, surged by 65-basis points to a positive reading of +0.10. This was the measure’s best reading since January and indicative of above average economic activity as the measure was pulled up by a 58-basis gain in the index components tied to production/income (to a contribution to CFNAI of +0.19) Also improving, although by far smaller amounts, were index components associated with employment (contribution to CFNAI of -0.02), consumption/housing (contribution to CFNAI of -0.07) and sales/orders/inventories (contribution to CFNAI of 0.00). The CFNAI’s 3-month moving average lost 4-basis points to a reading of -0.22. This reading indicates below average economic activity over the past 3 months.
Meanwhile, the Conference Board’s Leading Economic Index advanced 8/10ths of a point in April to a reading of 123.9 (2010=100). Nine of 10 components made positive contributions to the index during the month, led by the interest rate spread, manufacturing hours worked, jobless claims and building permits. The coincident index added 3/10ths of a point to 113.6, with all 4 components making a positive contribution to the index. The lagging index grew by 4/10ths of a point to 121.5, with 4 of 7 index component making a positive contribution. The press release noted that “labor market and financial indicators, and housing permits all point to a moderate growth trend continuing in 2016.”
Other data released over the past week that you might find of interest:
– Jobless Claims (week ending May 14, 2016, First-Time Claims, seasonally adjusted): 278,000 (-16,000 vs. previous week; +2,000 vs. the same week a year earlier). 4-week moving average: 275,750 (+1.9% vs. the same week a year earlier).
– Treasury International Capital Flows (March 2016, Net Domestic Securities Purchased by Foreign Investors): +$64.7 billion (vs. +$28.9 billion in February 2016, vs. +$45.4 billion in April 2015).
– FOMC meeting minutes (April 2016)
The opinions expressed here are not necessarily those of Kevin’s current and previous employers. No endorsements are implied.
