
February featured robust job creation, although the average number hours worked and average weekly earnings both declined during the month. Here are the 5 things we learned from U.S. economic data released during the week ending March 4.
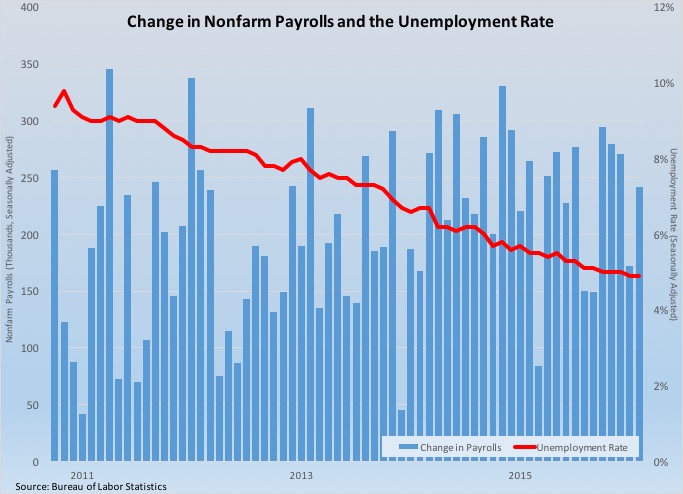
 The service sector led a robust month for job creation in February. The Bureau of Labor Statistics estimates nonfarm employers added 242,000 workers (on a seasonally adjusted basis) to their payrolls in February, the 4th time over the past 5 months in which employment grew by at least 200,000 jobs. Private sector employment increased by 230,000 jobs, with the service sector adding 245,000 workers. Among major industry sectors, the biggest job gains were seen in health care/social assistance (+57,400), retail (+54,900), leisure/hospitality (+48,000), professional/business services (+23,000) and construction (+19,000). Not everything in the report was good, however. While employers added workers, the average number of weekly hours worked and average weekly earnings both declined from their January readings. The former was off 2/10ths of an hour to 34.4 hours (vs. 34.6 hours in February 2015) while the latter dropped $6.11 to $872.04/week (up by only 1.6%. vs. February 2015).
A separate survey of households keeps the unemployment rate at its post-recession low of 4.9% and finds 555,000 people entering the labor force. The resulting labor force participation rate grew to 62.9%, having risen by a half percentage point since last September but still low by historic standards. Also growing was the median length of unemployment, up 3/10ths of a week to 11.2 weeks. Unchanged for the month was the count of “involuntary” part-time workers at 5.988 million (-9.7% vs. February 2015). And falling once again was the broadest measure of labor underutilization from the BLS (the U-6 series), having dropped 2/10ths of a percentage point to a post-recession low of 9.7%.
 The January trade report shows continued weakness in export activity. The Census Bureau and the Bureau of Economic Analysis report that the U.S. trade deficit grew by $1.0 billion during the month to -$45.7 billion, which was its highest point since last August. Exports declined by $3.8 billion to $176.5 billion, down 6.6% from January 2015 levels. Also falling was import activity, decreasing by $2.9 billion to $222.1 billion (4.5% below year ago levels). The former contracted thanks to lower exports for capital goods, industrial supplies/materials (including fuel oil) and consumer goods. Import activity slowed for industrial supplies/materials (including crude oil) and capital goods (including civilian aircraft). The goods deficit expanded by $1.1 billion to -$63.7 billion while the services surplus inched up by $0.1 billion to +$18.0 billion. The “real” trade deficit, based on 2009 chained dollars, grew by $1.9 billion to -$62.0 billion (+14.1% vs. January 2015).
 Purchasing managers tell us manufacturing shrank again in February while service sector growth slowed. The Purchasing Managers’ Index from the Institute for Supply Management added 1.3 points during the month to a seasonally adjusted 49.5. This was the diffusion index’s 5th straight month below a reading of 50.0, indicative of a contracting manufacturing sector. 3 of 5 PMI components improved during the month (production, inventories and employment), 1 held steady (new orders) and 1 contracted (supplier deliveries). 9 of 18 tracked manufacturing industries expanded during February; including, textiles, wood products and furniture. The press release stated that survey respondents were reporting “a more positive view of demand.”
The headline index from the ISM’s Report on Business—Nonmanufacturing declined for the 6th time in 7 months as it slipped 1/10th of a point to 53.4. Even with the recent weakness, the index of service sector activity has remained above a reading of 50.0 (and, therefore, consistent with an expanding service sector) for 72 straight months. Of the 4 index components, only that for business activity improved from its January mark. Falling were measures for new orders, supplier deliveries and employment. The employment reading of 49.7 was its 1st sub-50 reading in 2 years, hinting at possible weakness in the labor market (although the aforementioned employment report above would seem to suggest otherwise). 14 of 18 service sector industries expanded during the month, led by accommodation/food services, management of companies/support services and real estate. Even with the recent declines in the headline index, the press release stated that survey respondents were “projecting a slight optimism in regards to the overall economy.”
 Construction spending picked up in January. The Census Bureau estimates the value of construction put into place during the month was at a $1.141 trillion on a seasonally adjusted annualized basis, up 1.5% for the month and 10.4% from a year earlier. Private sector construction spending gained 0.5% to $827.3 billion (+9.5% vs. January 2015). While private sector residential spending was unchanged for the month, it was up 7.7% from a year earlier. While new single-family home construction spending slipped 0.2%, the same for new multi-family units jumped 2.6%. Private sector nonresidential spending gained 1.0% during January and was 11.5% above the year ago pace. Meanwhile, public sector construction spending jumped 4.5% during the month, which put it 13.0% above year ago levels.
 Auto sales remain a bright spot in the retail market. While essentially flat from January and below the torrid 18+ million seasonally adjusted annualized sales pace of last fall, auto sales remained strong in February. At 17.54 million units SAAR, auto sales were 7.0% above the year ago sales pace and were above 17 million units SAAR for 10 consecutive months, according to manufacturer sales reports collected by Autodata. Car sales were at 7.39 million units SAAR, virtually matching both the January 2016 and February 2015 sales pace. The 10.16 million unit annualized sales rate for light trucks/SUVs was unchanged from the previous month but up 13.0% from a year earlier. But then, cheap gasoline will do that.
Other data released over the past week that you might find of interest:
– Jobless Claims (week ending February 27, 2016, seasonally adjusted): 278,000 (+6,000 vs. previous week; -49,000 vs. same week a year earlier). 4-week moving average: 270,250 (-11.5% vs. same week a year earlier).
– Factory Orders (January 2016, New Orders, seasonally adjusted): $463.9 billion (+1.6% vs. December 2015, -1.9% vs. January 2015).
– Agricultural Prices (January 2016, Prices Received by Farmers): -0.7% vs. December 2015, -8.1% vs. January 2015.
– Productivity (4th Quarter 2015-revision, Nonfarm Business Output per Hour, seasonally adjusted annualized rate): -2.2% vs. Q3 2015, +0.5% vs. Q4 2014.
– Pending Home Sales (January 2016, Index (2001 = 100), seasonally adjusted): 106.0 (-2.5% vs. December 2015, +1.4% vs. January 2015).
– Beige Book (March 2016)
The opinions expressed here are not necessarily those of Kevin’s current and previous employers. No endorsements are implied.
