
GDP growth was not as poor as previously thought during Q4 2015 (although still quite weak) while there was a spark in consumer spending during January. Here are the 5 things we learned from U.S. economic data released during the week ending February 26.
 Even with a small upward revision, economic growth softened as 2015 wrapped up. The Bureau of Economic Analysis released its second estimate of 4th Quarter 2015 Gross Domestic Product (GDP), which showed the U.S. economy had expanded 1.0% on a seasonally adjusted annualized basis. This was up from the 0.7% gain reported a month earlier. The slight bump in the GDP estimate was the result of a higher than previously thought pace of private inventory accumulation and lower than previously believed import activity during the quarter. Of the major components of GDP, only personal consumption and fixed residential investment (i.e., housing) made positive contributions to Q4 economic growth. Drags on economic growth included fixed nonresidential investment, inventory accumulation and net exports. GDP increased 2.4% for all of 2015, matching 2014’s growth rate and up from 2013’s +1.5% pace. Economic expansion was uneven during 2015 with growth rates during the first 3 quarters of the year being +0.6%, +3.9% and +2.0%. The Personal Consumption Expenditures (PCE) deflator, a measure of inflation, grew only 0.5% on a seasonally adjusted annualized rate during Q4. Removing energy and food from the measure finds core prices grew a still modest 1.4%. The BEA will update its estimate of Q4 GDP once again at the end of March.
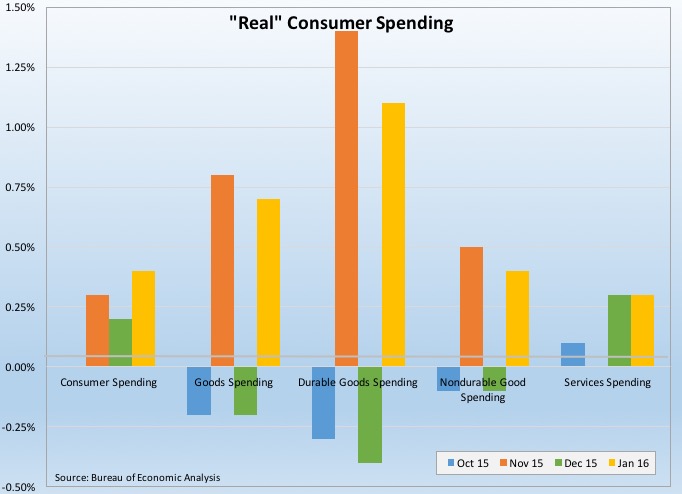
 January was the best month for consumer spending since last spring. The BEA estimates “real” personal spending grew 0.4% on a seasonally adjusted annualized basis during the month, following gains of 0.3% and 0.2% during November and December, respectively. Real spending on goods jumped 0.7% (following a 0.2% drop in December) with gains of +1.1% and 0.4% for durable and nondurable goods, respectively. The former reflected, in part, the continued strength of the car market. Spending on services increased by 0.3% for a 2nd consecutive month. Real consumer spending was up 2.9% from a
 year earlier, the best 12-month comparable since last September. “Nominal” (not adjusted for inflation) consumer spending grew 0.5% during the month and was 4.2% above the January 2015 pace. Nominal personal income increased 0.5% during the month, its fastest growth rate since last June and was up 4.3% over the past year. “Real” disposable income increased 0.4% in January but was up only 2.8% from a year earlier (the weakest year-to-year gains since the fall of 2014). Meanwhile, the savings rate held steady at +5.2%.
 January saw a small gain in sales of previously owned homes but weakness in the West and Midwest pulled down new home sales. Existing home sales crept up 0.4% during the month to a seasonally adjusted annualized rate (SAAR) of 5.47 million units, according to the National Association of Realtors. Sales grew in the Midwest (+4.0%) and Northeast (+2.7%), were unchanged in the South and declined 4.1% in the West. The measure of closed transactions of previously owned homes was up 11.0% from the January 2015 pace, with positive 12-month comparables in all 4 Census regions, including double-digit percentage gains in the Northeast (+20.6%) and Midwest (+18.2%). While inventories expanded 3.4% during the month to 1.82 million units, this was still down 2.2% from a year earlier and represented a very tight 4.0-month supply. As a result, the median sales price for previously owned homes was 8.2% above year ago levels at $213,800. NAR claims in its press release that the strength of the housing market “will likely help the U.S. economy avoid a recession.”
Meanwhile, the Census Bureau indicates new home sales dropped 9.2% during January to a seasonally adjusted annualized rate of 494,000 units, down 5.2% from the January 2015 pace and the worst month for new home sales since last March. Sales plummeted by nearly a third in the West and slumped 5.9% in the Midwest during the month, but grew in both the Northeast (+3.4%) and the South (+1.8%). Inventories of unsold homes expanded 2.1% during January to 238,000 units, up 14.4% year ago levels and the equivalent of a 5.8 month supply.
 Two measures of consumer sentiment ease during February. The Consumer Confidence Index from the Conference Board slid 5.6 points during February to a seasonally adjusted reading of 92.2 (1986 = 100), its lowest point since last July. The present conditions index lost 4.5 points to 112.1 (its worst reading since last November) while the expectations index shed 6.4 points to 78.9 (its lowest point since February 2014). The percentage of respondents who saw current business conditions as “good” declined 1.7 points to 26.0% while those that saw them as “bad” grew by a full percentage point to 19.8%. Similarly, fewer people expected conditions would improve over the next 6 months while anticipate they would “worsen.” The press release noted that while “continued turmoil” in the equity markets explained some of the deterioration in sentiment, the survey results suggest “the economy will continue to expand at a moderate pace in the near-term.”
Meanwhile, the Index of Consumer Sentiment from the University of Michigan slipped 3/10ths of a point to 91.7 (1966 Q1 = 100). This was a full 1-point improvement from the preliminary February figures released a few weeks earlier but down 3.7 points from the final February 2015 reading. The current conditions index added 4/10ths of a point to 106.8 (down 1/10th of a point from February 2015). The expectations index slipped 8/10ths of a point to 81.9 (down 6.1 points from February 2015). While acknowledging that confidence was down 6.5% from its January 2015 peak, the press release stated the decline “only indicates a somewhat slower pace of economic growth in 2016,” with their forecast for consumer spending growth at +2.7%.
 Another report finds manufacturing activity increased in January. The Census Bureau estimates new durable goods orders were at a seasonally adjusted $237.5 billion, up 4.9% for the month and 1.8% from a year earlier. This follows the prior week’s Industrial Production report that indicated a bounce in manufacturing output. Transportation equipment orders soared 11.5%, boosted by sharp increases in aircraft orders (defense: +84.8% and civilian: +54.2%) and a 3.0% bump up in orders for automobiles. Non-transportation orders grew 1.8%, its biggest single-month increase since July 2014. Most segments of durable goods enjoyed orders gains; including, machinery (+6.9%), fabricated metals (+1.6%), computers/electronics (+0.8%) and primary metals (+0.7%). Growing by 3.9% was a proxy for business investment: nondefense, nonaircraft capita orders. Meanwhile, shipments grew for the 2nd time in 3 months with a 1.9% gain to $241.9 billion (+0.9% vs. January 2015). Net of transportation goods, shipments increased by a more modest 0.2%. Unfilled orders eked out a 0.1% gain to $1.188 trillion while inventories of durable goods contracted for the 6th time in 7 months with 0.1% decline to $396.3 billion.
Other data released over the past week that you might find of interest:
– Jobless Claims (week ending February 20, 2016, seasonally adjusted): 272,000 (+10,000 vs. previous week; -36,000 vs. same week a year earlier). 4-week moving average: 272,000 (-7.8% vs. same week a year earlier).
– Chicago Fed National Activity Index (January 2016 0.00 = normal economic growth rate): +0.28 (up 66-basis points from December 2015, up 42-basis points from January 2015). 3-month moving average: -0.15 (up 15-basis point vs December 2015, down 35-basis points vs January 2015).
– Case-Shiller Home Price Index (December 2015, 20-City Index, Seasonally Adjusted): +0.8% vs. November 2015, +5.7% vs. December 2014.
The opinions expressed here are not necessarily those of Kevin’s current and previous employers. No endorsements are implied.
