
Ugh. Those 3 letters accurately describe the September payrolls report. But not every economic data point released last week was as unpleasant. Here are the 5 things we learned from U.S. economic data released during the week ending October 2.
 Payrolls data disappointed for a 2nd straight month in August. Not only was the Bureau of Labor Statistics’ seasonally adjusted estimate of nonfarm payrolls expanding by a feeble 142,000 during August a big disappointment, the BLS also lowered its previous estimate of July job gains by 37,000 to 136,000 jobs. July and August were the 2 worst months in terms of job creation since December 2013-January 2014. Private sector employers added 100,000 workers during August, with the biggest gains coming in health care/social assistance (+36,400), leisure/hospitality (+35,000) and retail (+23,700). Government employers added 24,000 jobs to their payrolls during August. Even worse was the 0.3% decline in weekly wages to $865.61, which represented a weak 2.2% year-to-year gain.
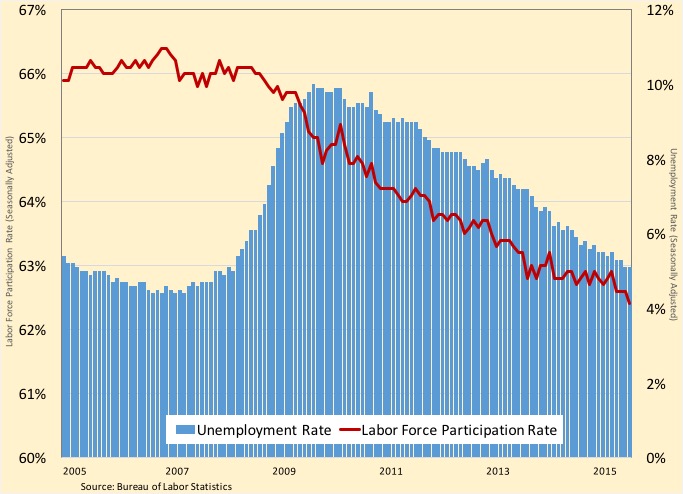
 According to a separate survey of households, the unemployment rate remained at its post-recession low of 5.1%. Yet, 350,000 people exited the labor force during the month, resulting in the civilian labor force participation rate shedding 2/10ths of a point to 62.4%. The labor force participation rate has not been this low since October 1977(!). A few good news data points from the household survey are that a.) the median length of unemployment dropped 7/10ths of a percentage point to 11.4 (essentially reversing the 8/10ths of a point gain in August); b.) the count of “involuntary” part-time workers (i.e., part-time workers seeking a full-time opportunity) dropped by 447,000 to a post-recession low of 6.036 million; and c.) the broadest measure of labor underutilization (the U-6 series) shed 3/10ths of a point to 10.0%. The latter measure has not been that low since May 2008.
 Consumer spending picked up in August. The Bureau of Economic Analysis estimates “real” personal consumption expenditures (PCE) grew 0.4% during the month to $11.287 trillion on a seasonally adjusted annualized basis (+3.2% vs. August 2014 levels). July’s growth rate was upwardly revised to a 0.3% gain. Spending on durable goods jumped 1.2% (think autos) while that for non-durables gained 0.6%. Spending on services increased 0.3%. Spending on a nominal basis (i.e., not adjusted for price variations) also grew 0.4% during August. Nominal personal income gained 0.3% for the month and was 4.2% above year ago levels. The savings rate slipped 1/10th of a point to +4.6%.
 Construction spending grew for the 12th time in 13 months during August. The Census Bureau estimates the value of construction put into service grew 0.7% to a seasonally adjusted annualized rate of $1.086 trillion. This was up 13.7% from a year earlier. Growing a similar 0.7% during the month was private sector construction spending, which has expanded 16.5% over the past year to $788.0 billion. Private residential spending jumped 1.3% during August (+16.1% vs. year ago levels), with spending on new single-family homes growing 0.7% and that for multi-family homes increasing 4.8%. Nonresidential construction spending edged up 0.2% for the month (and was up 16.9% from August 2014 levels) with the biggest month-to-month gains seen in construction for the health care sector. Public sector construction spending grew 0.5% during the month to $298.2 billion (+7.0% vs August 2014).
 A key measure of manufacturing sector activity cooled further in September. The Purchasing Managers Index (PMI) from the Institute for Supply Management fell for a 3rd straight month with a 9/10ths of a point decline to 50.2. While this was the PMI’s worst reading since June 2013, it also was its 33rd straight month with a reading above 50.0 (the threshold between an expanding and contracting manufacturing sector). 4 of 5 index components deteriorated during the month (production, new orders, supplier deliveries and employment) while the measure for inventories was unchanged. Only 7 of 18 tracked manufacturing industry sectors expanded during the month. The press release said survey respondents’ comments were “mixed with some concern about the global economy and customer confidence.”
 Contradicting a report released last week, The Conference Board finds consumer sentiment had improved in September. The group’s Consumer Confidence Index added 1.7 points during the month to hit 103.0 (1985 = 100), its best reading since January. The current conditions index surged 5.3 points during the month to hit another post-recession high of 121.1. The expectations index shed 6/10ths of a point to 91.0. 28.0% of survey respondents said current business conditions were “good” versus 16.7% saying they were “bad.” The press release noted that the softness in the expectations measure suggests consumers “do not foresee growth accelerating in the months ahead.”
Other data released over the past week that you might find of interest:
– Jobless Claims (week ending September 26, 2015, seasonally adjusted): 277,000 (+10,000 vs. week earlier); 4-week moving average: 270,750 (-1,000 vs. week earlier).
– Vehicle Sales (September 2015, seasonally adjusted annualized rate): 18.17 million (+2.0% vs. August 2015; +9.9% vs. September 2014).
– Pending Home Sales (August 2014, 2001=100): 109.1 (-1.4% vs. July 2015; +6.1% vs. August 2014).
– Case-Shiller Home Price Index (July 2015, 20-City Index, seasonally adjusted): -0.2% vs. June 2015, +5.0% vs. July 2014.
– Agricultural Prices (August 2015): +3.0% vs. July 2015; -6.4% vs. August 2014.
The opinions expressed here are not necessarily those of Kevin’s current and previous employers. No endorsements are implied.
