
July saw more than 200k jobs being created, but other economic metrics released last week did not inspire as much confidence. Here’s the U.S. economic data you missed during the week ending August 7.
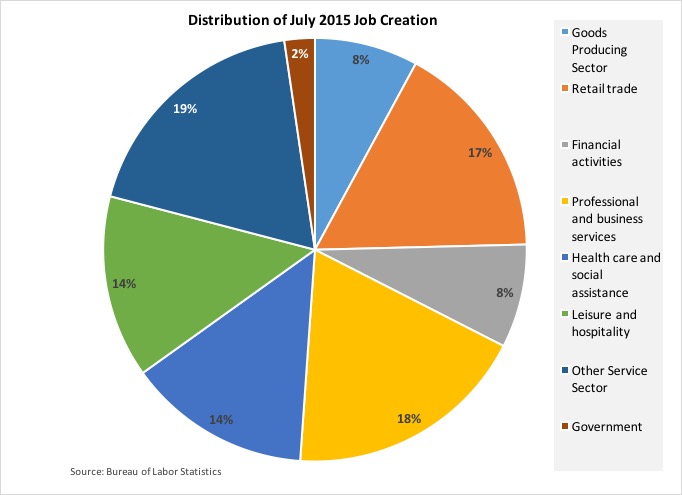
1. July job creation: Not bad…not great. The Bureau of Labor Statistics estimates nonfarm payrolls grew by 215,000 on a seasonally adjusted basis during the month, just below the 260,000 and 231,000 job gains of May and June, respectively, and a bit softer than consensus forecasts. The 142.071 million nonfarm jobs at the end of July was up 2.915 million from a year earlier, with an average monthly gain of 242,916. Private sector payrolls expanded by 210,000 jobs, split between gains of 193,000 in the service sector and 17,000 in the goods producing side of the economy. Payrolls expanded across most segments of the economy during July, with the industries enjoying the largest job gains being professional/business services (+40,000), retail (+35,900), health/social assistance (+30,100), leisure/hospitality (+30,000) and financial services (+17,000). The average workweek edged up 1/10th of an hour to 34.6 hours, with the resulting average weekly earnings at $865.65 (up 22 cents for the month and 2.4% from a year earlier).
The separate survey of households kept the unemployment rate at a post-recession low of 5.3%. But since only 69,000 adults entered the labor force during June, the labor force participation rate stayed at its 38-year low of 62.6%. Also unchanged for the month was the median length of unemployment of 11.3 weeks, which was down 2.2 weeks from a year. Workers who wanted a full-time job were more likely to actually have a full-time opportunity—6.223 million people held a part-time job but desired a full-time job, the smallest count of involuntary part-time workers since September 2008. Also falling to a post-recession low was the BLS’s broadest measure of labor utilization (the “U-6” series), which slipped 1/10th of a point to 10.4%. The metric has not been this low since June 2008.
2. Consumers took the month of June off. Consumer spending fell by less than 0.1% after adjusting for seasonal and price variations. The Bureau of Economic Analysis data indicates “real” spending on durable goods fell for the 1st time since February with a 1.1% drop, hurt by slower spending on vehicles and furniture. Real spending on nondurables were unchanged while that for services eked out a 0.2% increase. Real consumer spending has grown a relatively modest 2.9% over the past year, which includes 12-month comparables of +4.5%, 2.5% and 2.8% for spending on durables, nondurables and services, respectively. The same report finds personal incomes growing 0.4% for the month and 4.1% from a year earlier. The report’s measure of inflation—the PCE deflator—was up 0.2% for June and 0.3% over the past year. The 12-month comparables for the same measures were at +0.3% and +1.3%, respectively. The savings rate grew by 2/10ths of a percentage point to +4.8%.
3. The U.S. trade deficit expanded during June. The Bureau of Economic Analysis/Census Bureau estimates the U.S. trade balance deteriorated by $2.9 billion to a seasonally adjusted -$43.8 billion (its largest since March). Exports were essentially unchanged for the month at $188.6 billion (-3.6% vs. June 2014) while imports grew by $2.7 billion to $232.4 billion (-2.3% vs. June 2014), with monthly gains across most import categories. For the first 6 months of the year, exports have decreased 2.9% in comparison to the same 6 months a year earlier while imports declined 2.2%. The goods deficit widened by $2.9 billion during the month to -$63.5 billion while the services surplus held steady at +$19.7 billion. The U.S. had its largest goods deficits with China, the European Union, Germany, Mexico and Japan.
4. Two surveys of purchasing managers tell slightly different stories about July business activity. The Purchasing Managers Index from the Institute for Supply Management slipped 8/10ths of a point to 52.7. This was the 31st straight month in which the measure of manufacturing activity was above a reading of 50.0, indicative of growth. Only 3 of 5 index components improved during the month (production, new orders and supplier deliveries) while the inventories and employment measures both contracted during the month. 11 of 18 tracked manufacturing segments expanded during July, led by textiles, paper products and apparel. The press release said survey respondents’ comments “reflect a combination of optimism mixed with uncertainties about international markets and the impacts of the continuing decline in oil prices.”
It appears the service sector had a better month. The ISM’s headline index for the nonmanufacturing sector surged 4.3 points to a reading of 60.3. This was the 66th consecutive month in which the index indicated growth and its best reading since the measure’s launch in 2008. All 4 index components—business activity, new orders, employment and supplier deliveries—gained in July as 14 of 18 segments expanded during the month. The segments enjoying the fastest growth during the month were education, arts/entertainment, public administration and wholesale trade.
5. Construction spending stagnated in June, thanks to weakness in business investment. The Census Bureau estimates the seasonally adjusted annualized value of construction put into place during the month at $1.065 trillion. Even though this was up by only 0.1% for the month, it was 12.0% above year ago levels. Private construction spending declined 0.5% to $766.4 billion (SAAR, +13.7% vs. June 2014). While private sector residential construction spending stepped up 0.4% during June, nonresidential construction spending dropped 1.3% (with declines across most categories). The 12-month comparables for the two were +12.8% and +14.6%, respectively. Public sector construction spending grew 1.6% during June to $298.2 billion, which was up 8.0% from a year earlier.
Other data released over the past week that you might find of interest:
– Factory Orders (June 2015): +1.8% vs. May 2015, -6.2% vs. June 2014.
– Jobless Claims (week ending August 1, 2015): 270,000 (+3,000 vs. week earlier); 4-week moving average: 268,250 (-6,500 vs. week earlier).
– Vehicle Sales (July 2015): 17.55 million units (SAAR) (+3.3% vs. June 2015, +6.2% vs. July 2014).
– Consumer Credit (June 2015): Outstanding balances $3.422 trillion (+$20.7 billion vs. May 2015, +6.6% vs. June 2014).
The opinions expressed here are not necessarily those of Kevin’s current and previous employers. No endorsements are implied.
