
As the Fed inches towards its first interest rate hike in 9 years, we learned that the U.S. economy moderately expanded during the spring. Here’s the U.S. economic data you missed during the week ending July 31.
1. It is not 100% certain the Federal Open Market Committee (FOMC) will raise short-term rates in September (or even by the end of the year), but it still seems like a good bet. The policy statement released following last week’s FOMC meeting noted that the economy “has been expanding moderately in recent months.” While household spending was growing at a “moderate” pace, the housing market “has shown additional improvement” and the labor market was showing “diminished” underutilization, the committee remained concerned about business investment and international trade. As a result, the FOMC voted to maintain the near-zero fed funds target rate and to continue reinvesting principal payments made on its massive investment holdings. The statement reinforced the FOMC’s desire to see “some further improvement” in the labor market and gain “reasonable” confidence that inflation will move to the Fed’s 2-pecent target before it would raise the fed funds target rate. Expectations remain that the first hike will happen this fall. Regardless when it does happen, the statement stressed that rates would rise slowly as “economic conditions may, for some time, warrant keeping” interest rate below their long-term “normal” levels.
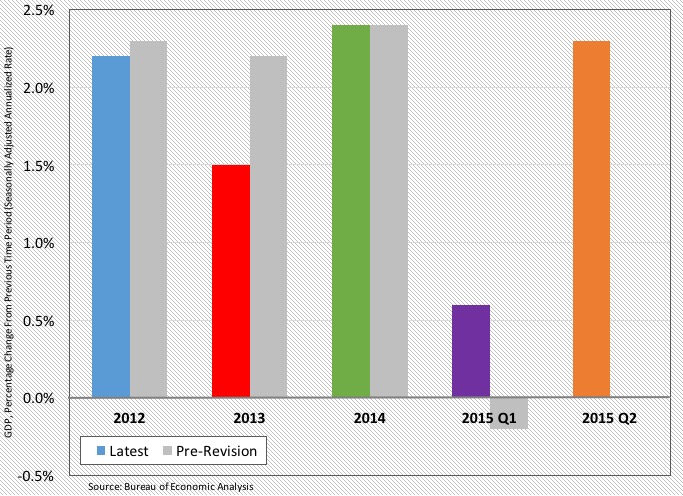
2. The U.S. economy expanded during the 2nd quarter and the 1st quarter was not as bad as previously believed. The Bureau of Economic Analysis estimates the Gross Domestic Product (GDP) grew 2.3% on a seasonally adjusted annualized basis between April and June. This was up from a 0.6% gain during the 1st quarter, itself reflecting an upward revision from the previously reported 0.2% contraction for the first 3 months of 2015. A 2.9% annualized increase in consumer spending was responsible for 199-basis points of the Q2 GDP gain, with smaller positive contributions coming from fixed residential investment (+21-basis points), government expenditures (+14-basis points) and net exports (+13-basis points). Slightly weighing on GDP were a decline in business investment and a slower pace of business inventory expansion. The BEA also revised GDP data going back several years, showing the economic expansion during 2011-2014 was slower than previously believed (an average annual GDP growth rate of +2.0% versus the previous estimate of +2.3% growth). The BEA will update its 2nd quarter GDP estimate twice over the next 2 months.
3. Durable goods orders grew for the 1st time in 3 months during June, boosted by a big bump in orders for transportation goods. The Census Bureau estimates new orders for manufactured durable goods totaled a seasonally adjusted $235.3 billion during the month, up 3.4% for the month but still 2.8% below year ago levels. Much of the monthly gain was the product of a 66.1% surge in civilian aircraft orders, a 16.9% increase in defense aircraft orders and a 0.2% gain in orders for motor vehicles. After removing the impact of the 8.9% gain in transportation goods orders, core durable goods gained 0.8%. Even though this was the largest single-month gain in core durable goods orders since last August, the 12-month comparable was a miserable -4.5% (its worst in more than 2 years). Orders for non-defense, non-aircraft capital goods (a measure of business investment) increased 0.9% for the month but remained 5.2% below year ago levels.
4. Consumer confidence—especially that for the future—wilted slightly in the summer heat. The Conference Board Consumer Confidence Index plunged 8.9 points during July to fall to a seasonally adjusted reading of 90.9 (1985=100), its lowest reading since last September. The current conditions index shed 2.9 points to 107.4 while the expectations index plummeted 12.9 points to 79.9. The latter measure has not been this low since late 2013. The press release attributes the drop to “less optimistic outlook for the labor market, and perhaps the uncertainty and volatility in financial markets prompted by the situation in Greece and China.” But even with the drop, the Conference Board stressed that the survey results are consistent “with an expanding economy and a relatively confident consumer.”
The Index of Consumer Sentiment from the University of Michigan shed 3.0 points during July to 93.1 (1966 Q1 = 100), keeping the measure within the low to mid 90s range where it has been for most of 2015. The present conditions index shed 1.7 points to 107.2 while the expectations index lost 3.7 points to 84.1. Inflation expectations edged up, with 1-year and 5-year expectations both at +2.8%. The press release said “the data provide no indication of a break in the prevailing positive trend.” But it also warns that few consumers are anticipating the pending hike in interest rates, noting that “[s]urprise hikes are associated with larger initial impacts on spending, exactly what the Fed would like to avoid.”
5. Even with a slight drop in June, a forward looking measure of home sales remained near a post-recession high. The Pending Home Sales Index, the National Association of Realtors’ measure of home purchase contract signing activity, slipped 1.8% during the month to a seasonally adjusted 110.3. The index fell 3.0% during the month in both the South and Midwest, but inched up in the West (+0.5%) and Northeast (+0.4%). The index was 8.2% above year ago levels and was near a 9-year high. NAR sees tight inventories of homes as holding back sales activity: “The demand is there for more sales, but the determining factor will be whether or not some of these buyers decide to hold off even longer until supply improves and price growth slows.”
Other data released over the past week that you might find of interest:
– Jobless Claims (week ending July 25, 2015): 267,000 (+12,000 vs. week earlier) 4-week moving average: 274,750 (-3,750 vs. week earlier)
– Case Shiller Home Price Index 20-city (May 2015): +1.1% vs. April 2015 (-0.2% vs. April 2015 after seasonal adjustments)
– Agricultural Prices (June 2015): -1.9% vs. April 2015.
– Bankruptcy Filings (12-month period through June 30, 2015): 879,736 filings (-12.0% vs. a year earlier)
The opinions expressed here are not necessarily those of Kevin’s current and previous employers. No endorsements are implied.
