
Retailers maintain their momentum while employers search for workers. Here are the five things we learned from U.S. economic data released during the week ending May 14.

Retailers held onto recent sales gains. The Census Bureau reports retail and food services sales totaled a seasonally adjusted $619.9 billion in April, unchanged from the previous month. “Unchanged” is impressive as March saw sales surging 10.7 percent, thanks to the latest round of economic stimulus checks, brightening economic prospects, and loosening pandemic-related restrictions. Sales at auto dealers/parts stores rose 3.1 (after swelling 17.1 percent in March) while that at gas stations slipped 1.1 percent. Net of both, core retail sales declined 0.8 percent after rising 8.9 percent during the previous month. In April, sales rose at retailers focused on electronics/appliances (+1.2 percent), health/personal care (+1.0 percent), and groceries (+0.6 percent). Restaurants/bars reported sales were up 3.0 percent for the month after enjoying a 13.5 percent jump in March. Sales slowed at retailers focused on apparel (-5.1 percent), sporting goods/hobby (-3.6 percent), furniture (-0.7 percent), and building materials (-0.4 percent). Highlighting just how bad retail sales were in April 2020: retail sales were up 51.2 percent from one year earlier, with core retail sales 37.6 percent ahead of their year-ago pace.

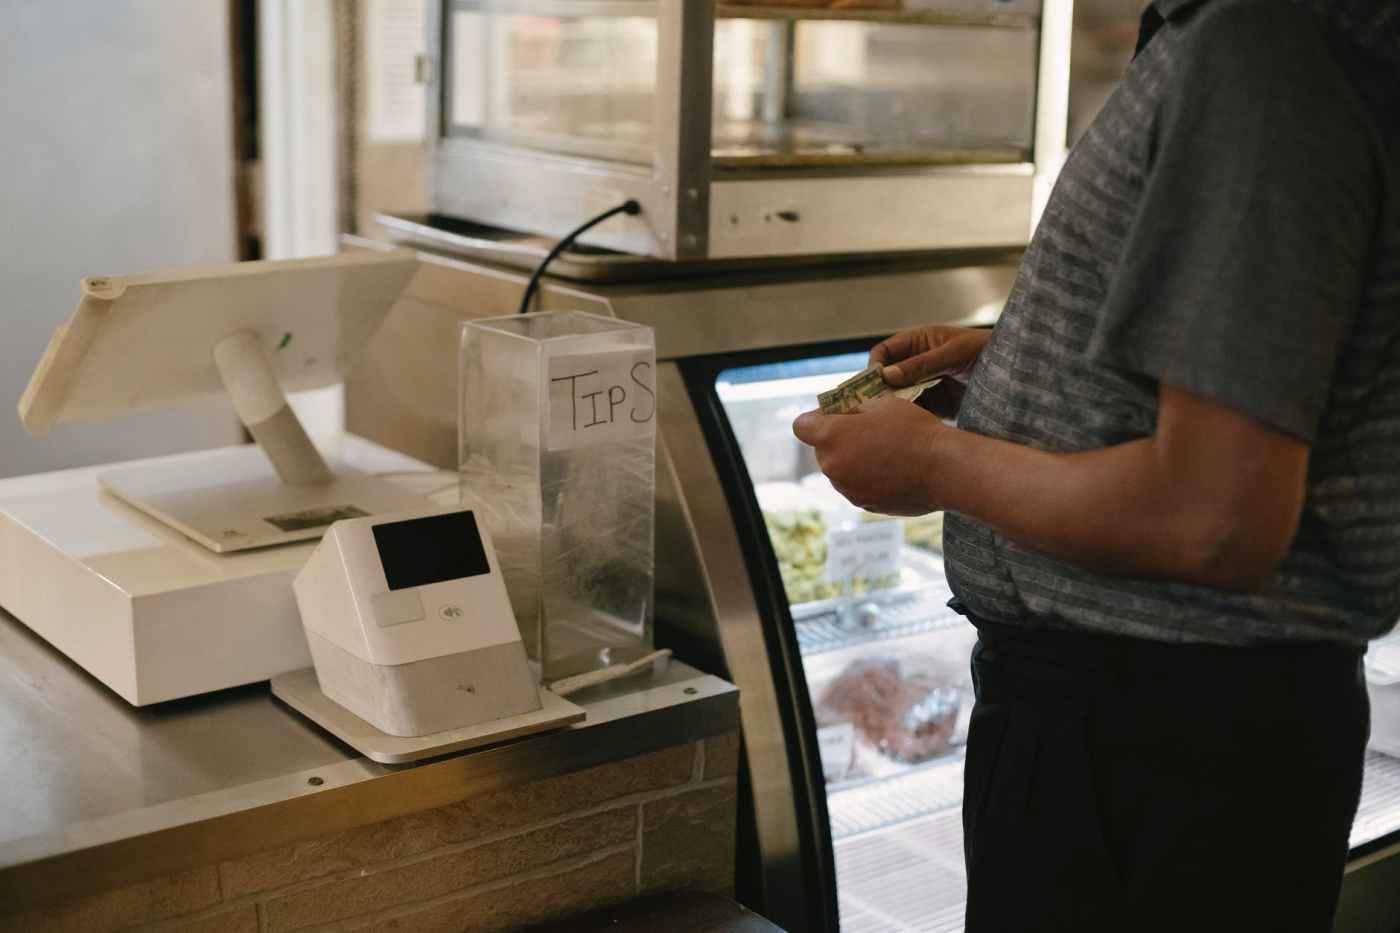
Job openings rose in March, but hiring does not keep up. There were a seasonally adjusted 8.123 million open jobs at the end of March, up 597,000 for the month and a record for the Bureau of Labor Statistics measure. The private sector had 7.290 million open jobs, with significant increases reported by employers in leisure/hospitality, state/local education, manufacturing, and construction. Employers hired 6.009 million workers in March, up 215,000 from February. Private-sector hiring rose by 142,000 to 5.632 million. 5.322 million people separated from their jobs during the month, off 107,000 from February. 3.508 million people quit their jobs in March (its highest reading since the start of the pandemic), while layoffs fell by 243,000 to a pandemic low of 1.480 million.

Manufacturing growth slowed in April. The Federal Reserve estimates manufacturing output increased a seasonally adjusted 0.4 percent during the month, down from March’s 3.1 percent surge. Durable goods production fell 0.4 percent, as chip shortages led to a 4.3 percent slump in automobile production. Nondurables output increased 1.3 percent. Overall industrial production grew 0.7 percent (March 2021: +2.4 percent), with output in mining and at utilities rising by 0.7 percent and 2.6 percent, respectively. Relative to year-ago levels (when the worst of the worst of the pandemic economic downturn occurred), manufacturing has risen 23.0 percent while industrial production has jumped 23.0 percent. Factory utilization continued to rise, adding a half-point in the manufacturing sector to 74.9 percent but still below its 49-year average of 78.1 percent.

Prices rose in April. The Consumer Price Index (CPI) jumped a seasonally adjusted 0.8 percent during the month. The Bureau of Labor Statistics measure has not risen by as much since 2009 and occurred despite energy CPI slipping 0.1 percent (gasoline: -1.4 percent). Food CPI grew 0.4 percent, with fruit and vegetable prices rising 0.8 percent. Net of energy and food, core CPI swelled 0.9 percent, its biggest single-month gain since April 1982, with increases across almost every category. Used cars/truck prices surged 10.0 percent, while the index for new vehicles added a half percentage point. Also advancing were prices for transportation services (+2.9 percent), medical care commodities (+0.6 percent), shelter (+0.4 percent), and apparel (+0.3 percent). Over the past year, CPI has surged 4.2 percent (its largest year-to-year advance since 2009), while the core metric had a 12-month comparable of +3.0 percent. Of course, the year-to-year increases are in the context of April 2020, during which both the U.S. and global economies were in freefalls.
The BLS also tells us that the final demand Producer Price Index (PPI) rose a seasonally adjusted 0.6 percent in April, following a 1.0 percent jump during the prior month. The core measure, net of energy, food, and trade services, jumped 0.6 percent (its first increase below one percent this year). Wholesale energy prices pulled back 2.4 percent (gasoline: -3.4 percent), while food prices swelled 2.1 percent (nearly matching March’s 2.2 percent advance). Core goods PPI increased 1.0 percent. Over the past year, headline PPI has risen 6.2 percent while the core measure had a 12-month comparable of +4.6 percent. The same caveat about year-to-year comparisons noted above also holds here.

Small business owner sentiment improved in April. The National Federation of Independent Business’ Small Business Optimism Index added 1.6 points during the month to a seasonally adjusted 99.8 (1986=100). The index has not been this high since last November, with eight of its ten components improving in April (led by measures for earnings trends, plans to make capital outlays, and current inventories). Pulling back, however, were measures linked to expectations for the economy and plans to increase employment. The press release noted that the inability to find qualified workers “remains the biggest challenge for small businesses and is slowing economic growth.”
Other U.S. economic data released over the past week:
- Jobless Claims (Week ending May 8, First-Time Claims, seasonally adjusted): 473,000, -34,000 vs. the previous week, -1,842,000 vs. the same week a year earlier). 4-week moving average: 534,000 (-83.2% vs. the same week a year earlier).
- Import Prices (April 2021, All Imports): +0.7% vs. March 2021, +10.6% vs. April 2020. Nonfuel Imports: +0.7% vs. March 2021, +5.0% vs. April 2020.
- Export Prices (April 2021, All Exports): +0.8% vs. March 2021, +14.4% vs. April 2020. Nonagricultural Exports: +0.9% vs. March 2021, +13.1% vs. April 2020.
- University of Michigan Surveys of Consumers (May 2021-preliminary, Index of Consumer Sentiment (1966Q1=100), seasonally adjusted): 82.8 (April 2021: 88.3, May 2020: 72.3).
- Business Inventories (March 2021, Manufacturers’ and Trade Inventories, seasonally adjusted): $2.013 trillion (+0.3% vs. February 2021, Unchanged vs. March 2020).
The opinions expressed here are not necessarily those of Kevin’s current employer. No endorsements are implied.
