

The Federal Reserve expects near-zero short-term interest rates through at least 2022. Here are the five things we learned from U.S. economic data released during the week ending June 12.

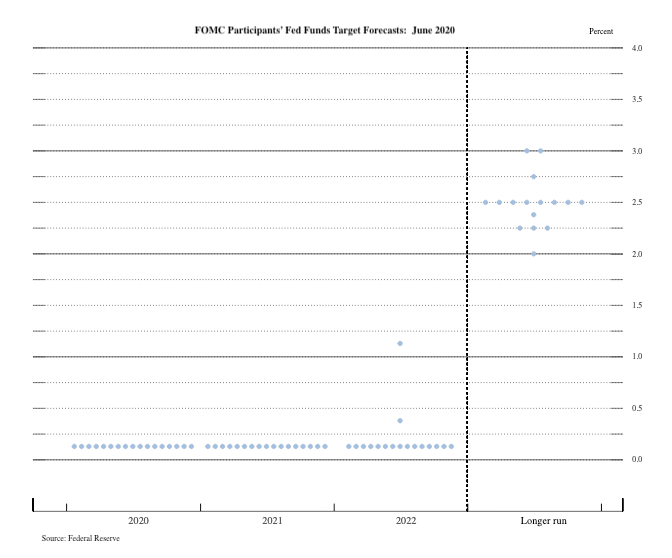
The Fed held steady and signals it will continue to do so for quite a while. The policy statement released following the past week’s Federal Open Market Committee meeting nearly matched that the April 29 statement. The open sentence reaffirmed the Fed’s commitment to using “its full range of tools to support the U.S. economy in this challenging time, thereby promoting its maximum employment and price stability goals.” Even as they saw improving financial conditions, the committee members voted unanimously to keep the fed funds target rate at a range between 0.00 and 0.25 percent. Further, the FOMC anticipates keeping the near-zero percent target rate until “it is confident that the economy has weathered recent events and is on track to achieve its maximum employment and price stability goals.”
FOMC members’ economic forecasts, released in conjunction with the policy statement, suggest it will not be before the end of 2022. In fact, only two forecasters expect the fed funds rate will rise any time in the next 2.5 years. The median forecast has the U.S. economy contracting 6.5 percent in 2020 but rebounding 5.0 percent in 2021 and 3.5 percent in 2022. The typical forecast has the unemployment rate at 9.5 percent during Q4 of this year, dropping to 6.5 percent in 2021 and 5.5 percent in 2022. FOMC members also anticipate inflation will remain below its two-percent target over the next few years.

Consumer prices sank for a third straight month. The Consumer Price Index (CPI) declined 0.1 percent in May after falling 0.8 percent and 0.4 percent in April and March, respectively. The Bureau of Economic Analysis indicates that energy CPI dropped 1.8 percent, its smallest monthly decrease since last December, with gas prices pulling back 3.5 percent. Meanwhile, food prices jumped 0.7 percent (less than half of April’s increase) with prices of meat, poultry, fish, and eggs rising 3.7 percent. Net of energy and food, core CPI slipped 0.1 percent. Falling were prices for transportation services (-3.6 percent), apparel (-2.3 percent), and used cars/trucks (-0.4 percent). Prices gained for medical care services (+0.6 percent), new vehicles (+0.3 percent), shelter (+0.2 percent), and medical care commodities (+0.1 percent). Consumer prices have increased a mere 0.1 percent over the past year, while core CPI’s 12-month comparable was +1.2 percent.

but food drove an increase in wholesale prices. The Producer Price Index (PPI) for final demand rose 0.4 percent in May following three monthly declines (including a 1.3 percent drop in April). The Bureau of Labor Statistics reports that its core wholesale price measure, which nets out energy, food, and trade services, gained a more modest 0.1 percent. Wholesale prices for goods jumped 1.6 percent with increases for both food (+6.0 percent, including a 40.4 percent surge for meat) and energy. Net of both, core PPI for final demand goods held steady in May. PPI for final demand services edged down 0.2 percent, including a 0.8 percent decline for trade services (reflecting tighter retailer & wholesale margins). Over the past year, wholesale prices have fallen 0.8 percent, with the 12-month comparable for core PPI slipping 0.4 percent.

April…but so did job separations. The Bureau of Labor Statistics reports that employers had a seasonally adjusted 5.046 million open jobs at the end of April, down by nearly a million from March and 30.7 percent from the same month a year earlier. Every major industry segment reported year-to-year percentage declines in available jobs greater than 20 percent. Employers hired 3.524 million workers in April, down 1.587 million from March and 41.3 percent from a year earlier. As with job openings, virtually every industry experienced sharp year-to-year declines in hiring, including a 71.9 percent drop in leisure/hospitality and a 54.4 percent tumble in construction. 9.888 million people left their jobs in April, well below the 14.643 million who did so in March but 71.6 percent above the year-ago count. 7.716 million people lost their jobs through a layoff during the month (March 2020: 11.489 million, April 2019: 1.950 million).

Small business owner sentiment rebounded in May. The Small Business Optimism Index from the National Federation of Independent Business grew by 3.5 points during the month to a seasonally adjusted 94.4 (1986=100). This followed two monthly declines that saw the index shed more than 13 points. Eight of ten index components advanced in May, led by a sharp rebound for the measure tracking expected real sales and rising readings for plans to increase employment, plans to increase inventories, and expectations for the economy. Declining were index components for earnings trends and current job openings. The press release said that business owners were “optimistic about future business conditions and expect the recession to be short-lived.”
Other U.S. economic data released over the past week:
- Jobless Claims (Week ending June 6, First-Time Claims, seasonally adjusted): 1,542,000 (-355,000 vs. the previous week, +1,322,000 vs. the same week a year earlier). 4-week moving average: 2,002,000 (+819.4% vs. the same week a year earlier).
- University of Michigan Surveys of Consumers (June 2020-preliminary, Index of Consumer Sentiment (1966Q1=100), seasonally adjusted): 78.9 (May 2020: 72.3, June 2019: 98.2)
- Import Prices (May 2020, All Imports, not seasonally adjusted): +1.0% vs. April 2020, -6.0% vs. May 2019, Nonfuel Imports: +0.1% vs. April 2020, -0.7% vs. May 2019.
- Export Prices (May 2020, +0.5% vs. April 2020, -6.0% vs. May 2019. Nonagricultural Exports: +0.6% vs. April 2020, -6.3% vs. May 2019.
- Wholesale Inventories (April 2020, Total Inventories of Merchant Wholesalers, seasonally adjusted): $650.4 billion (+0.3% vs. March 2020, -2.8% vs. April 2019.
- Monthly Treasury Statement (May 2020 (1st 8 Months of FY2020), U.S. Government Budget Surplus/Deficit): -$1.880.3 trillion (vs. 1st 8 Months of FY2019: -$738.6 billion).
The opinions expressed here are not necessarily those of Kevin’s current employer. No endorsements are implied.
