
The first set of data reflecting the impact of the COVID-19 pandemic—jobless data—came out last week. Here are the five things we learned from U.S. economic data released during the week ending March 27.
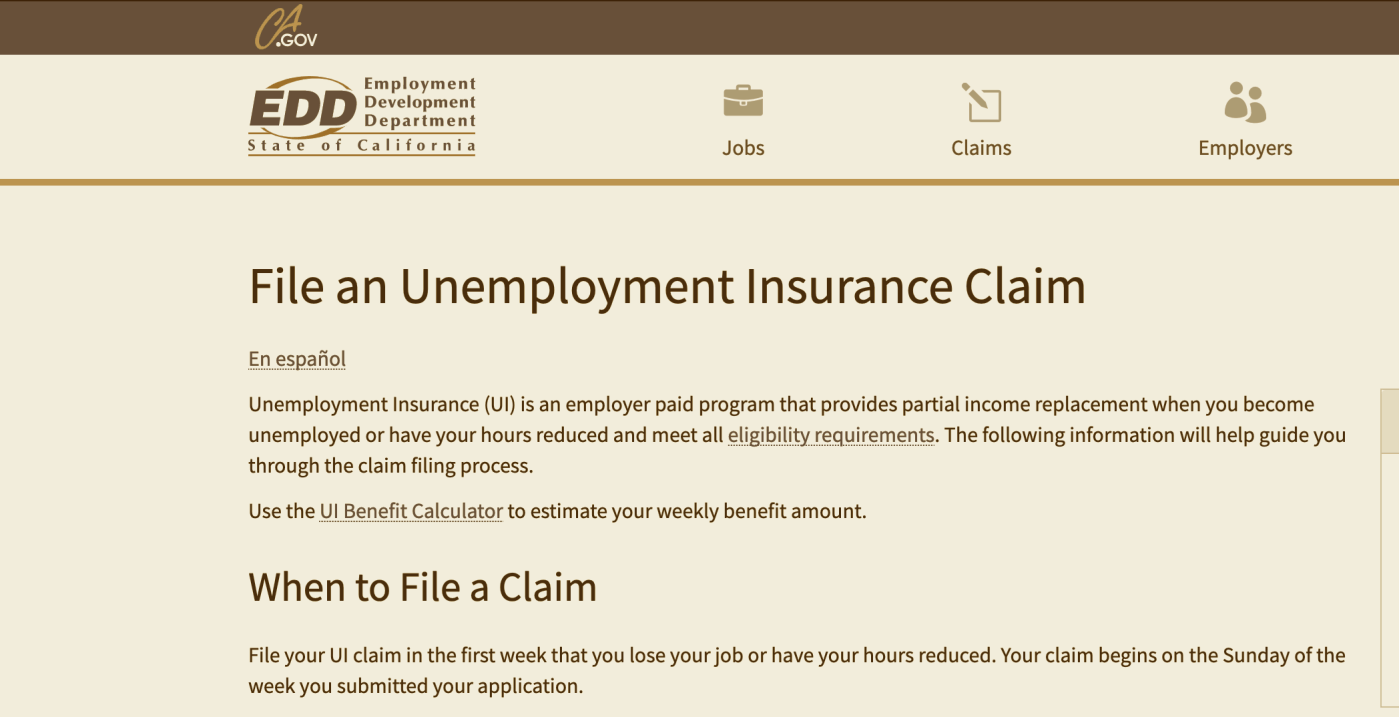
 COVID-19 layoffs led to a record number of jobless claims. The Department of Labor reports there were a seasonally adjusted 3.283 million first-time claims made for unemployment insurance benefits during the week ending March 21. The number of initial claims was up by more than 3 million filings from the prior week, 1,164 percent from the same week a year ago, and shatters the previous record of 695,000 claims back in October 1982. The press release noted that job cuts came from many industries, including the service sector (“particularly accommodation and food service”), health care/social assistance, arts/entertainment/recreation, transportation/warehousing, and manufacturing industries. As large as the number was, the data likely are underestimating actual layoff activity (due to capacity issues on claim filing websites and not all laid-off workers being aware of their eligibility for benefits).
 Growth in personal income held steady in February but sputtered for personal spending. The Bureau of Economic Analysis reports that personal income rose at a seasonally adjusted 0.6 percent in February, matching the previous month’s growth rate. Disposable personal income—which nets out personal taxes—jumped 0.5 percent during the month with the “real” measure—which adjusted for inflation—increased 0.4 percent. Personal consumption expenditures (PCE) grew by a more modest 0.2 percent (matching January’s increase) while real PCE inched up 0.1 percent. Real spending on goods fell by 0.2 percent, including durable goods expenditures slumping 0.7 percent. Edging up was real spending on nondurable goods (+0.1 percent) and services (+0.2 percent). The savings rate bloomed by 3/10ths of a percentage point to +8.2 percent (its highest reading since last March). Over the past year, real disposable income has risen 2.2 percent, while the 12-month comparable for real spending was +3.0 percent.
 Meanwhile, economic activity picked up in February. The Chicago Fed National Activity Index (CFNAI), a weighted index of 85 economic indicators, added 49-basis points during the month to a reading of +0.16 (its best mark since last November and indicative of economic growth higher than the historical average). Forty-four of the 85 indicators made positive contributions to the CFNAI, with the other 41 measures having negative impacts on the headline index. Also, all of the advance came from production-related indicators, with much smaller positive contributions coming from indicators tied to employment and personal consumption/housing. Measures linked to sales/orders/inventories made a small negative contribution. The CFNAI’s three-month moving average deteriorated by ten-basis points to -0.21. The Federal Reserve Bank of Chicago’s website included this statement: “The data through February were unlikely to have been affected much by the COVID-19 outbreak.” This will not be true for March’s report.
 Q4 2019 was likely the final quarter of economic growth for a while. The Bureau of Economic Analysis’ final estimate of Gross Domestic Product (GDP) for the last three months of 2019 finds the U.S. economy expanded 2.1 percent on a seasonally adjusted annualized basis. This matched the two previous estimates of Q4 GDP growth and followed growth rates of +2.1 percent and +2.0 percent during the two prior quarters. GDP increased 2.3 percent for all of 2019, down from gains of 2.9 percent in 2018 and 2.4 percent in 2017. The same report shows corporate profits grew an annualized 2.6 percent in Q4 after contracting 0.2 percent during the prior quarter. For all of 2019, corporate profits were flat when compared to 2018. We will see the first estimate of Q1 data—the first GDP report reflecting coronavirus impacts—on April 29.
 New home sales slowed in February. The Census Bureau estimates new home sales declined 4.4 percent during the month to a seasonally adjusted annualized rate (SAAR) of 765,000 units. Despite the decline, sales were 14.3 percent above year-ago levels. February sales slumped in the West (-17.2 percent) and Midwest (-7.3 percent) but advanced in the Northeast (+38.9 percent) and South (+1.0 percent). All four Census regions enjoyed year-to-year sales increases. There were 319,000 homes available for sale at the end of the month, off 0.9 percent for the month and 6.7 percent from a year earlier. This was the equivalent to a 5.0 month supply of homes.
Other U.S. economic data released over the past week:
– FHFA House Price Index (January 2020, Purchase-Only Index, seasonally adjusted): +0.3% vs. December 2019, +5.2% vs. January 2019.
The opinions expressed here are not necessarily those of Kevin’s current employer. No endorsements are implied.
