
The U.S. labor market added 22.6 million jobs during the 2010s. Here are the five things we learned from U.S. economic data released during the week ending January 10.
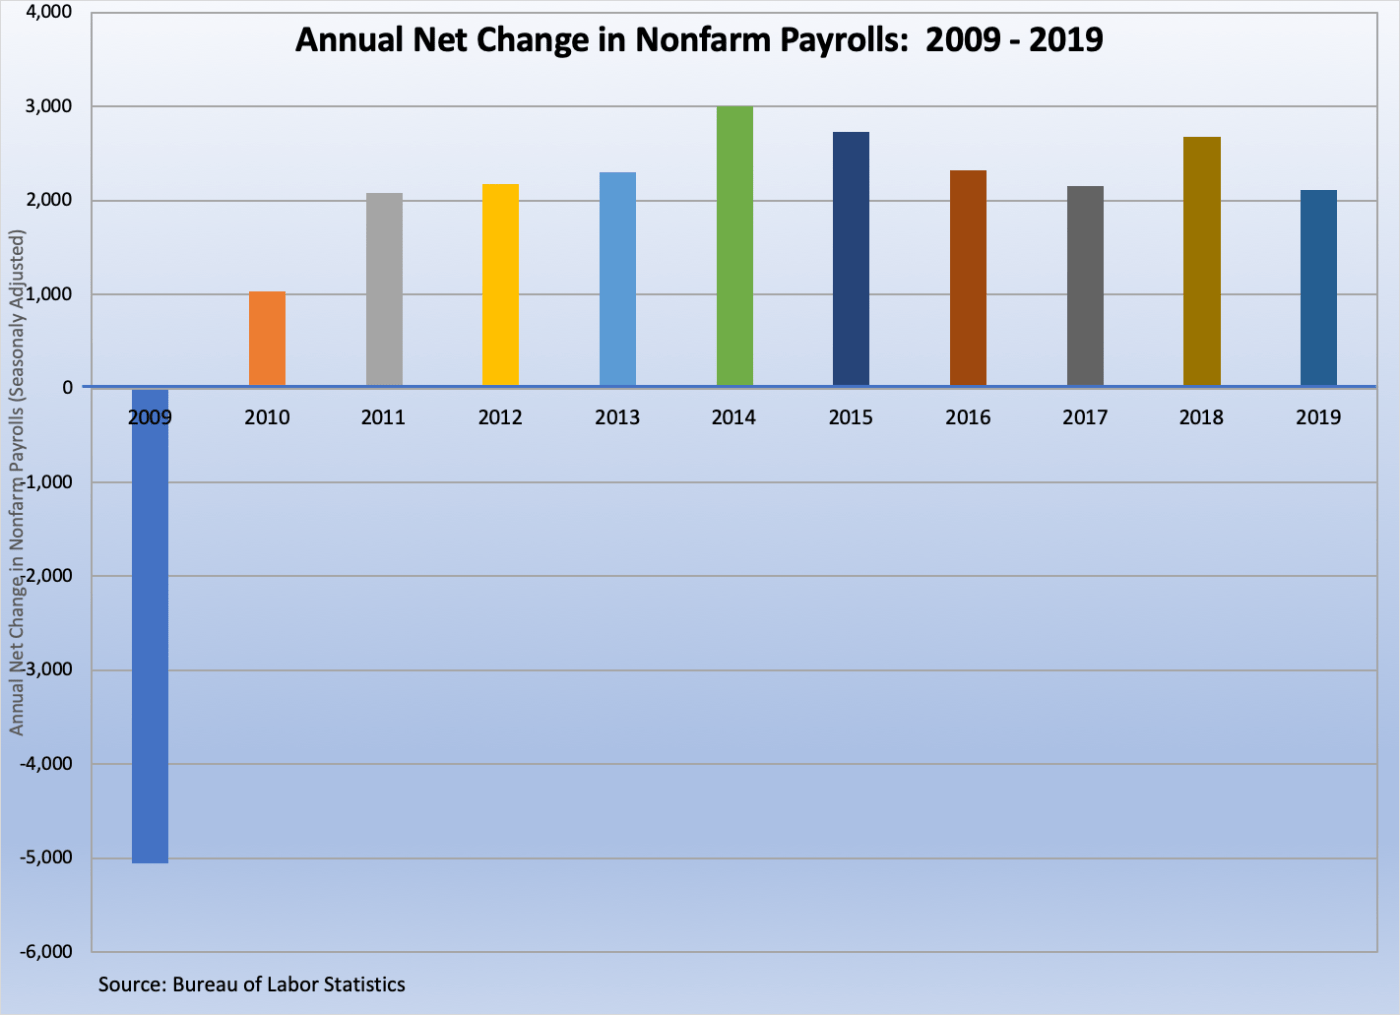
 2019 was the 10th straight year of job gains. The Bureau of Labor Statistics reports that nonfarm payrolls expanded by a seasonally adjusted 145,000 in December. This was the 111th straight month of job gains, although the smallest single-month gain since last May. The 2.11 million jobs added jobs for all of 2019 also was the fewest for a year since 2011 (although 2017’s count of 2.15 million was not much larger). All of December’s payrolls gain came from the service sector, which added 140,000 jobs, while the goods-producing side of the economy shed 1,000 workers. The industries adding the most jobs during the month were retail (+41,200), leisure/hospitality (+40,000), health care/social assistance (+33,900), and construction (+20,000). Manufacturing employment fell by 12,000 in December. The same report notes that average hourly earnings have grown 2.9 percent over the past year to $28.32.

A separate households survey keeps the unemployment rate at a post-recession low of 3.5 percent and finds 209,000 people entering the labor market during the month. The labor force participation rate held steady at 63.2 percent, with the same measure for adults 25-54 eking out a 1/10th of a percentage point increase to 82.9 percent (its highest point since June 2009). The median length of unemployment declined by 2/10ths of a week to 9.0 weeks (December 2018: 9.4 weeks), while the count of part-time workers seeking a full-time job fell to a post-recession low of 4.148 million (December 2018: 4.655 million). The broadest measure of labor underutilization (the U-6 series) slipped by 2/10ths of a point to 6.7 percent (the lowest ever for the 26-year old data series).
 Service sector business activity remained robust in December. The NMI, the headline index from the Institute for Supply Management’s Nonmanufacturing Report on Business, added 1.1 points to a reading of 55.0. Not only was this the NMI’s best mark since last August, but it also represented the 119th consecutive month in which the measure was above a reading of 50.0, the threshold between a growing and contracting service sector. Two of four NMI components improved in December: business activity/production (up 5.6 points to 57.2) and supplier deliveries (up a full point to 52.5). The other two measures fell: new orders (down 2.2 points to 54.9) and employment (down 3/10ths of a point to 55.2). Eleven of 18-tracked service sector industries reported growth in December, led by retail, arts/entertainment/recreation, and management of companies/support services.
 New factory orders continued to struggle in November. The Census Bureau finds new orders for manufactured goods dropped for the third time in four months with a $3.6 billion decrease to a seasonally adjusted $493.0 billion. Durable goods orders fell by $5.2 billion to $242.2 billion, while orders for nondurables grew by $1.6 billion to $250.8 billion. On the bright side, new orders for civilian goods rose 0.7 percent while those for civilian non-aircraft capital goods inched up 0.2 percent. Shipments grew by $1.7 billion to $502.2 billion, with gains for durable and nondurable goods of $0.1 billion and $1.6 billion, respectively. Unfilled orders fell for the second time in three months, shrinking by $4.9 billion to $1.159 trillion while inventories expanded by $2.0 billion to $701.0 billion, its 11th gain in 12 months.
 The trade deficit narrowed in November. The Census Bureau and the Bureau of Economic Analysis state that exports increased by $1.4 billion during the month to a seasonally adjusted $208.6 billion (+0.3 percent versus November 2018) while imports fell by $2.5 billion to $251.7 billion (-3.8 percent versus November 2018). The resulting trade deficit of -$43.1 billion was down $3.9 billion from October and its smallest reading in more than three years. The goods deficit narrowed by $3.9 billion to -$63.9 billion while the service surplus mostly held steady at +$20.8 billion. The U.S. had its largest goods deficits with China (down $2.2 billion to -$25.6 billion), European Union (-$13.5 billion), and Mexico (-$8.5 billion).
 Consumers took on more debt in November, but credit card balances declined. The Federal Reserve estimates consumers had outstanding non-real estate backed credit balances of $4.176 trillion (seasonally adjusted). This represented an increase of $12.5 billion for the month and 4.5 percent from a year earlier. Consumers shed $2.3 billion in outstanding revolving credit—i.e., credit cards—to $1.086 trillion (+2.9 percent versus November 2018). On the flipside, nonrevolving credit balances, including those for student and auto loans, grew by $14.9 billion to $3.090 trillion, up 5.0 percent from a year earlier.
Other U.S. economic data released over the past week:
– Jobless Claims (week ending January 4, 2020, First-Time Claims, seasonally adjusted): 214,000 (-9,000 vs. previous week; -7,000 vs. the same week a year earlier). 4-week moving average: 224,000 (+0.1% vs. the same week a year earlier).
– Wholesale Trade (November 2019, Merchant Wholesaler Inventories, seasonally adjusted): $674.9 billion (-0.1% vs. October 2019, +3.3% vs. November 2018).
The opinions expressed here are not necessarily those of Kevin’s current employer. No endorsements are implied.
