
Job openings, factory orders, and trade activity all declined in September. Here are the five things we learned from U.S. economic data released during the week ending November 8.
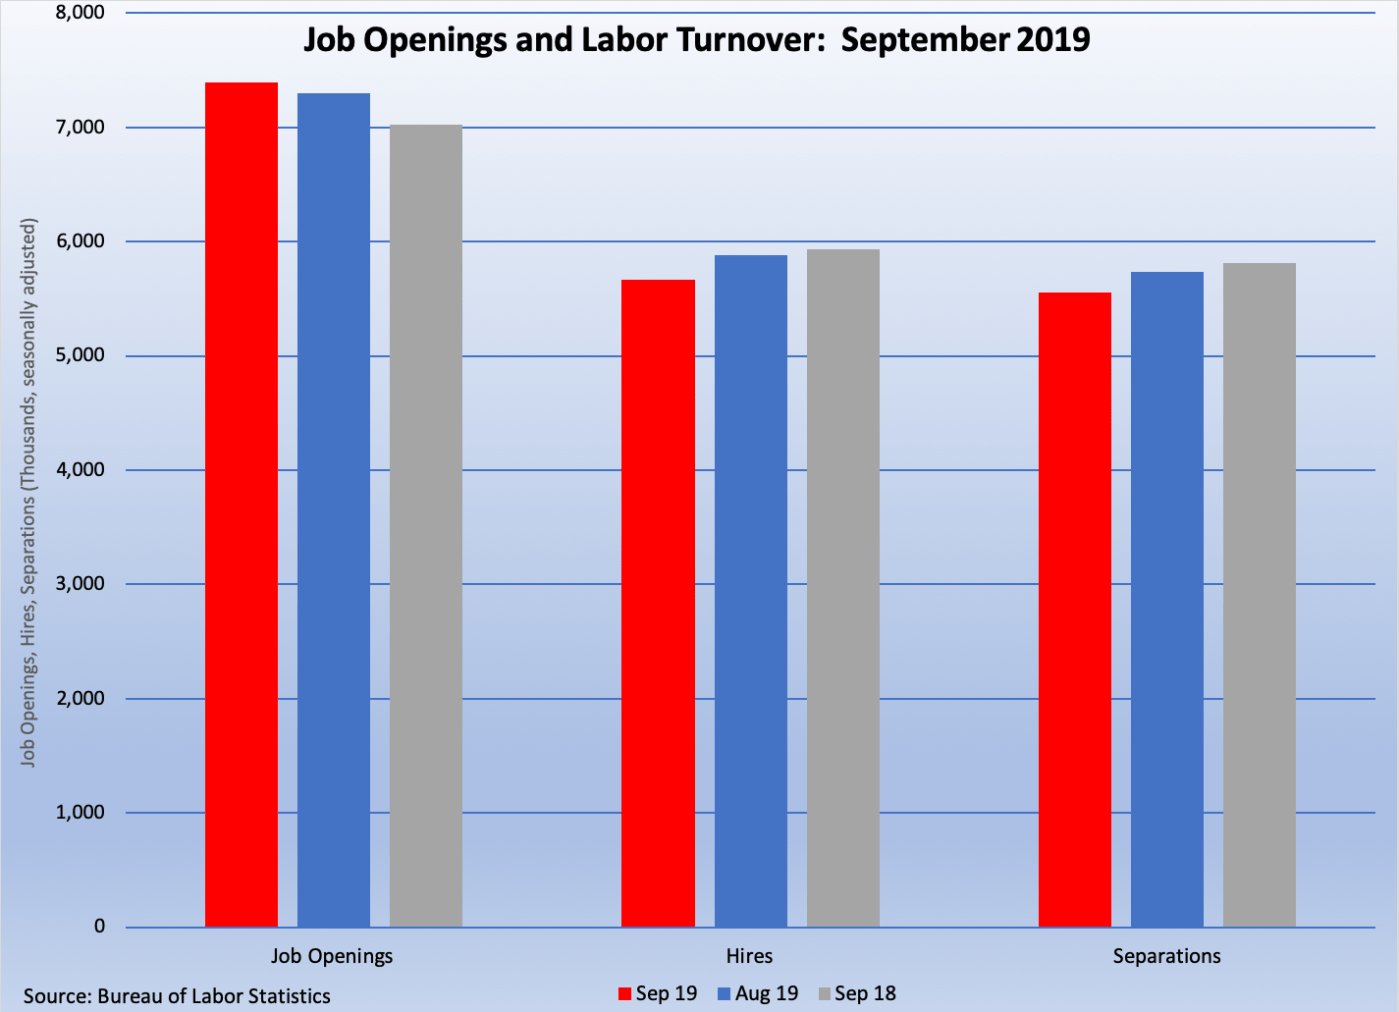
 The number of job openings fell, but hiring increased in September. The Bureau of Labor Statistics estimates that there were a seasonally adjusted 7.024 million jobs on the final day of September, down 277,000 for the month and 5.0 percent from a year earlier. (It is worth noting that this is still a large number of available jobs by historical standards.) Private-sector job openings were 7.0 percent below that from a year earlier, with substantial year-to-year percentage declines in retail (-27.0 percent), accommodation/food services (-15.7 percent), health care (-11.2 percent), and wholesale trade (-11.0 percent). Meanwhile, hiring grew by 50,000 during the month to 5.934 million, up 4.7 percent from a year earlier. Private-sector hiring outpaced September 2018 levels by 4.5 percent. 5.808 million people left their jobs in September, up 76,000 for the month and 4.5 percent over the past year. Fewer people voluntarily departed their jobs in September, down 103,000 from August to 3.498 million (+3.1 percent versus September 2018). On the other hand, layoffs jumped by 152,000 to 1.964 million (+8.0 percent versus September 2018).
 Factory orders slowed in September. The Census Bureau estimates new orders for manufactured goods declined 0.6 percent during the month to a seasonally adjusted $496.7 billion. Durable goods orders slumped 1.2 percent while orders for nondurable edged up 0.1 percent. Civilian capital goods orders net of aircraft—a proxy for business investment—slowed 0.6 percent in September. Shipments fell for the third straight month, shedding 0.2 percent to $501.1 billion. Unfilled orders slightly lost ground (-$0.1 billion) after two monthly gains (to $1.163 trillion). Inventories expanded 0.3 percent to $697.9 billion.
 Exports and imports decelerated in September. The Census Bureau and the Bureau of Economic Analysis report that exports declined by $1.8 billion during the month to $206.0 billion (-1.8 percent versus September 2018) while imports fell by $4.4 billion to $258.4 billion (-2.8 percent versus September 2018). As a result, the trade deficit narrowed by $2.6 billion in September to -$52.5 billion, down 6.5 percent from a year earlier. The goods deficit contracted by $2.7 billion to -$71.7 billion (-7.2 percent versus September 2018), while the services surplus declined by $0.1 billion to +$19.3 billion (-9.0 percent). The former included the impact of declining exports of both food (soybeans) and automobiles and lower imports of consumer goods (including cell phones, toys, and artwork), capital goods, and automotive vehicles.
 Service sector activity picked up in October. The NMI, the headline index from the Institute for Supply Management’s Nonmanufacturing Report on Business, added 2.1 points during the month. The resulting reading of 54.7 signaled the 117th straight month of service sector growth. All four NMI components improved in October: employment (up 3.3 points), new orders (up 1.9 points), business activity/production (up 1.8 points), and supplier deliveries (up 1.5 points). Thirteen of 18 nonmanufacturing industries expanded during the month, led by agriculture, utilities, and professional/scientific/technical services. The press release noted that survey respondents “continue to be concerned about tariffs, labor resources and the geopolitical climate.”
 Productivity sputtered during the summer. The Bureau of Labor Statistics finds nonfarm business labor production declined 0.3 percent on a seasonally adjusted basis during Q3, after having grown 2.3 percent during the prior quarter. Nonfarm output rose 2.1 percent, with the number of hours worked gained 2.4 percent. Productivity has risen 1.4 percent over the past year. Manufacturing sector production inched down 0.1 percent during Q3, with a 1.1 percent increase in manufacturing output and a 1.3 percent gain in hours worked. Durable goods manufacturing productivity gained 1.2 percent during the quarter while that for nondurables manufacturing contracted 1.5 percent.
Other U.S. economic data released over the past week:
– Jobless Claims (week ending November 2, 2019, First-Time Claims, seasonally adjusted): 211,000 (-8,000 vs. previous week; -6,000 vs. the same week a year earlier). 4-week moving average: 215,250 (-0.9% vs. the same week a year earlier).
– University of Michigan Surveys of Consumers (November 2019-preliminary, Index (1966Q1=100), seasonally adjusted): 95.7 (vs. October 2019: 95.5, vs. November 2018: 97.5).
– Consumer Credit (September 2019, Outstanding Consumer Credit Balances, net of mortgages and other real estate-backed mortgages, seasonally adjusted): $4.193 trillion (+$9.5 billion vs. August 2019, +4.9% vs. September 2018).
– Wholesale Trade (September 2019, Inventories of Merchant Wholesalers, seasonally adjusted): $676.7 billion (-0.4% vs. August 2019, +4.8% vs. September 2018).
– Senior Loan Officer Opinion Survey
The opinions expressed here are not necessarily those of Kevin’s current employer. No endorsements are implied.
