

The 2017 holiday season was merry for many members of the retail sector. Here are the five things we learned from U.S. economic data released during the week ending January 12.
 Retail sales ended 2017 on a high note. The Census Bureau estimates U.S. retail and food services sales grew 0.4 percent during the month to a seasonally adjusted $495.4 billion (+5.6 percent versus December 2016). This follows an upwardly revised 0.9 percent gain in November, signaling a healthy retail market during the just completed holiday season. Sales increased 1.2 percent at building material retailers, 0.7 percent at restaurant/bars, and 0.2 percent at auto dealers/parts stores while those at gas stations held firm during the month. Net of all four of those segments, core retail sales gained 0.3 percent during December following a 0.9 percent bump in November. Core retail sales have risen 5.6 percent over the past year. Sales gained in December at grocery stores (+0.7 percent), furniture retailers (+0.6 percent), health/personal care stores (+0.4 percent) but fell at sporting goods/hobby stores (-1.6 percent), department stores (-1.1 percent), apparel retailers (-0.3 percent), and electronics/appliance stores (-0.2 percent). Finally, sales at nonstore retailers (i.e., web retailers) jumped 1.2 percent during December and rose 12.7 percent over the past year. Nonstore retail sales have zoomed up 57.4 percent since December 2012, well above the five-year comparable for overall retail sales (+21.0 percent).
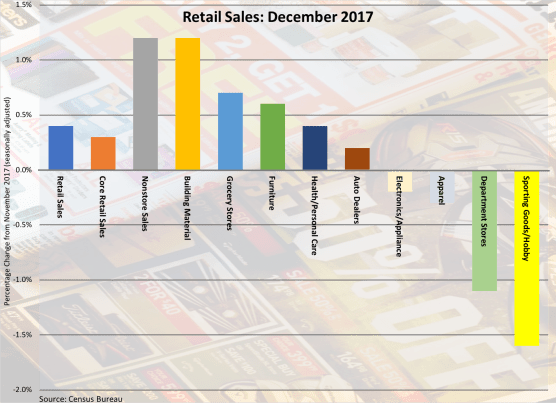
 Core consumer prices grew at their fastest rate since last January. The Consumer Price Index (CPI) increased 0.1 percent on a seasonally adjusted basis during December, leaving the Bureau of Labor Statistics measure up 2.1 percent for all of 2017. Energy CPI declined 1.2 percent during the month, as gasoline prices fell 2.7 percent. Food CPI gained 0.2 percent, as prices for meats/poultry/fish/eggs jumped 0.9 percent. Net of energy and food, core CPI climbed 0.3 percent for the month and 1.8 percent over the past year. This was the largest single-month increase in core consumer prices in 11 months. Rising during the month were prices for used vehicles (+1.4 percent), medical commodities (+1.0 percent), new vehicles (+0.6 percent), shelter (+0.4 percent), transportation services (+0.3 percent), and medical services (+0.2 percent).
 But wholesale prices chilled, thanks to decreases for food and trade services. Per the Bureau of Labor Statistics, the Producer Price Index (PPI) for final demand declined 0.1 percent on a seasonally adjusted basis during December, following 0.4 percent increases during each of the two previous months. The core measure—final demand PPI net of energy, food, and trade services—grew 0.1 percent during the months, its smallest monthly increase since last August. Final demand goods wholesale prices held steady during November, with prices for food falling 0.7 percent and that for energy goods holding unchanged. Net of energy and food, wholesale goods prices grew 0.2 percent. PPI for final demand services declined 0.2 percent, its first decline since last February. PPI for trade services—measuring retailer and wholesaler margins—dropped 0.6 percent. Over the past year, final demand PPI has grown 2.6 percent while that net of food, energy, and trade services has increased 2.3 percent.
 Counts of both job openings and people hired slowed slightly during November. The Bureau of Labor Statistics reports that there were a seasonally adjusted 5.879 million job openings at the end of November, down 46,000 from October but still up 4.4 percent from the same month a year earlier. The private sector had 5.360 million job openings at the end of November, a 6.0 percent increase from a year ago. The industries with the largest year-to-year percentage gains in job openings were manufacturing (+18.5 percent), construction (+18.0 percent), financial activities (+17.3 percent), leisure/hospitality (+13.0 percent), and retail (+11.8 percent). Employers hired 5.488 million people during November, off 104,000 for the month but 4.3 percent ahead of the year-ago pace. Private sector hiring has grown 4.0 percent over the past year to 5.110 million workers. Industries with the largest year-to-year percentage increases in hiring were manufacturing (+25.0 percent), financial activities (9.7 percent), professional/business services (+5.8 percent), and health care/social assistance (+4.9 percent). 5.202 million people left their jobs during November, down 49,000 for the month but up 2.5 percent from a year earlier. Voluntary quits have risen 3.9 percent over the past year while layoffs have inched up by a slower 1.6 percent rate.
 Small business owners’ confidence slipped in December. The National Federation of Independent Business’ Index of Small Business Optimism shed 2.6 points during the month to a seasonally adjusted 104.9 (1986=100). While this reading was off 9/10ths of a point from a year earlier, it was just above the index’s 2017 average of 104.8 (which itself was a record for the measure). Only two of the index’s ten components improved during the month: measures for both plans to make capital outlays and current job openings added a point during December. Falling were measures for expectations for the economy to improve (-11), plans to increase inventories (-8), expectations for real sales (-6), earnings trends (-5), and plans to increase employment (-4).
Other U.S. economic data released over the past week:
– Jobless Claims (week ending January 6, 2018, First-Time Claims, seasonally adjusted): 261,000 (+11,000 vs. previous week; +16,000 vs. the same week a year earlier). 4-week moving average: 250,750 (-0.6% vs. the same week a year earlier).
– Business Inventories (November 2017, Manufacturers’ and Trade Inventories, seasonally adjusted): $1.895 trillion (+0.4% vs. October 2017, +3.2% vs. November 2016).
– Import Prices (December 2017, All Imports, not seasonally adjusted): +0.1% vs. November 2017, +3.0% vs. December 2016. Nonfuel Imports: -0.1% vs. November 2017, +1.4% vs. December 2016.
– Export Prices (December 2017, All Exports, not seasonally adjusted): -0.1% vs. November 2017, +2.6% vs. December 2016. Nonagricultural Exports: Unchanged vs. November 2017, +2.7% vs. December 2016.
– Consumer Credit (November 2017, Outstanding Consumer Credit Balances-net of real estate-backed loans, seasonally adjusted): $3.827 trillion (+$27.9 billion vs. October 2017, +5.3% vs. November 2016).
The opinions expressed here are not necessarily those of Kevin’s current employer. No endorsements are implied.
