
Personal spending and overall economic activity both slowed in August. Here are the five things we learned from U.S. economic data released during the week ending September 29.
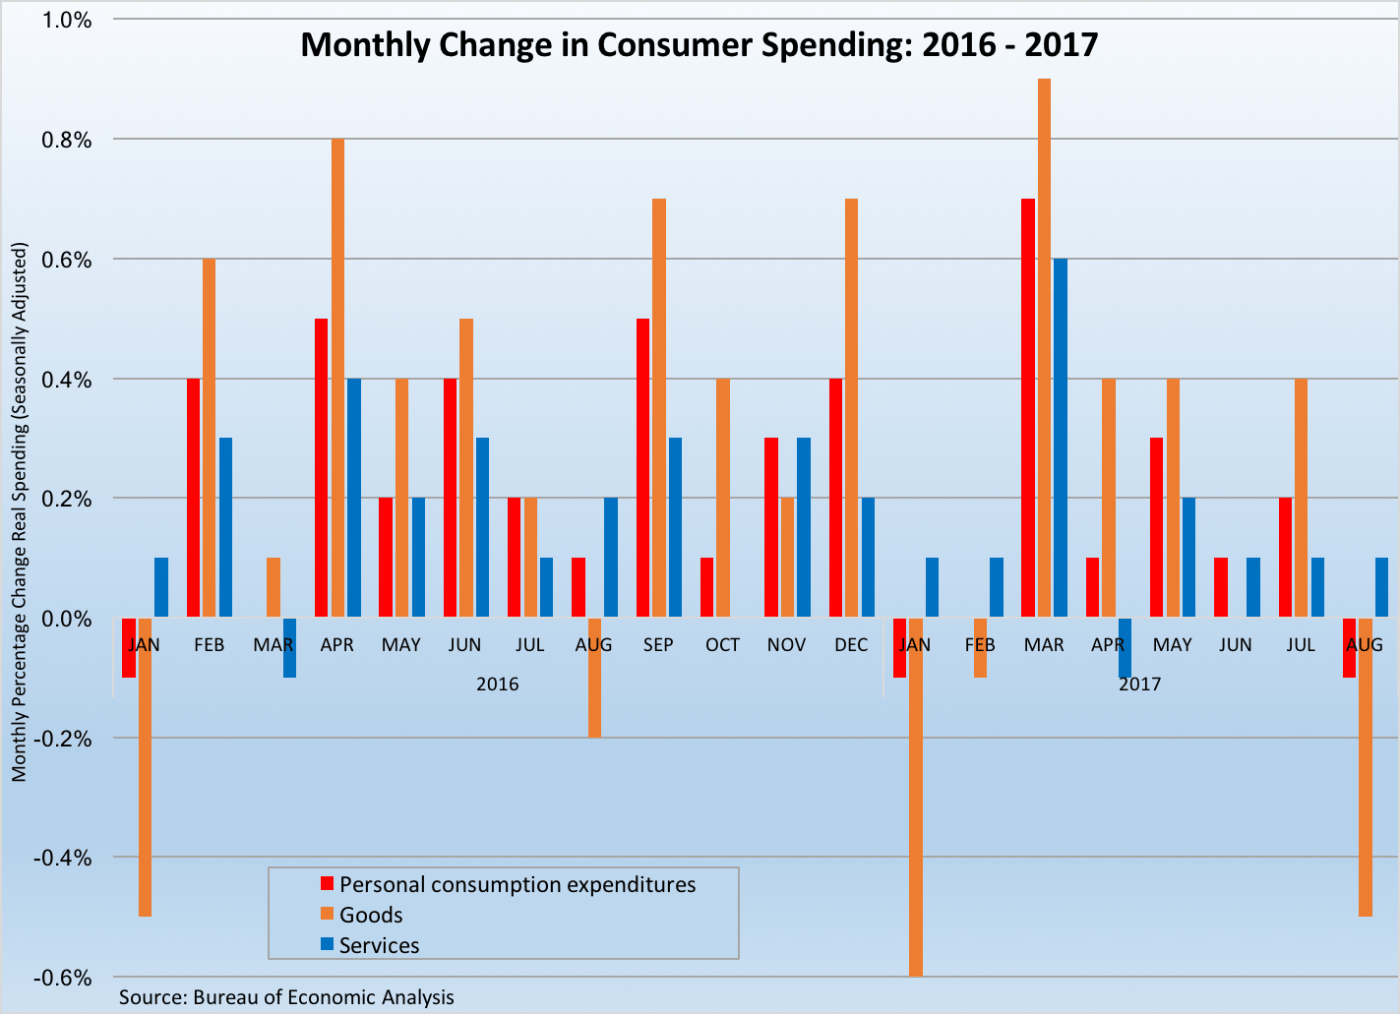
 Personal spending paused in August. “Real” personal consumption expenditures (PCE) slipped 0.1 percent on a seasonally adjusted basis during the month, the first monthly decline in the inflation-adjusted measure of consumer spending since January. Real spending on goods fell 0.5 percent (also its largest drop since January), as spending on durable goods dropped 1.0 percent while that on nondurables slowed 0.2 percent. Real spending on services edged up 0.1 percent. Over the past year, real PCE has grown 2.5 percent, with 12-month comparables of +3.1 percent and +2.2 percent for spending on goods and services, respectively. The same Bureau of Economic Analysis report finds nominal (not adjusted for inflation) personal income had increased 0.2 percent during August while nominal disposable income grew 0.1 percent and real disposable income slipped 0.1 percent. Real disposable income has risen 1.2 percent over the past year. The personal saving rate was at +3.6 percent, matching July’s rate. The report’s closely watched measure of inflation—the PCE deflator—grew 0.2 percent during the month and had increased 1.2 percent over the past year. Net of energy and food, the core PCE deflator inched up 0.1 percent during the month and had risen 1.3 percent since August 2016. Both 12-month comparables were well below the Federal Reserve’s two-percent interest rate target.
 There was another small upward revision to Q2 economic growth. The Bureau of Economic Analysis upgraded its estimate of second-quarter 2017 growth in the Gross Domestic Product (GDP) from a 3.0 percent seasonally adjusted annualized gain to a 3.1 percent increase (the original Q3 estimate had a 2.6 percent increase). The small upward revision was the result of higher than previously believed levels of private sector inventory accumulation. This was the fastest month of economic growth since the first quarter of 2015. Positive contributors to Q3 GDP growth were personal consumption expenditures (PCE, adding 224-basis points to GDP growth), nonresidential fixed investment (+54 basis points), exports (+21-basis points), federal government spending (+13-basis points), and the change in private inventories (+12-basis points). Dragging down GDP growth were fixed residential investment (housing, costing 30-basis points in GDP growth), imports (-22-basis points), and state/local government expenditures (-16-basis points). Corporate profits from current production edged up 0.7 percent during the quarter to a SAAR of $2.123 trillion.
 However, economic data suggest economic growth slowed in August. The Chicago Fed National Activity Index (CFNAI) fell by 34-basis points to a reading of -0.31. The CFNAI is a weighted index of 85 economic measures indexed so that a reading of 0.00 would be indicative of economic growth at the historical average. Hence, August’s reading is consistent with below average economic activity. This was the CFNAI’s lowest reading since May 2016. Only 35 of the 85 index components made a positive contribution to the CFNAI, but 45 components improved from their July’s readings. Among the four broad categories of components, two made negative contributions to the CFNAI: those associated with production (-0.36 contribution) and personal consumption/housing (-0.06). Boosting the CFNAI were components tied to sales/orders/inventories (+0.06) and employment (+0.05). The CFNAI’s three-month moving average was negative for the first time since March as it shed four-basis points to a reading of -0.04.
 Consumer sentiment chilled in the autumn air of September. The Conference Board Consumer Confidence Index inched back 6/10ths of a point to a seasonally adjusted reading of 119.8 (1985=100). The index of current conditions fell back by 2.3 points to 146.1 while the expectations index added a half point to 102.2. A slightly smaller percentage of survey respondents characterized current business conditions as being “good” (33.9 percent, off 6/10th of a percentage point) while a few more said that they were “bad” (up 6/10ths of a percentage point to 13.8 percent). Twice as many respondents expected business conditions would improve over the next six months than believe they will deteriorate (19.8 percent versus 9.9 percent). The press release noted that sentiment weakened in both hurricane impacted Texas and Florida, but also that the overall results indicate “the economy will continue expanding at its current pace.”
The Index of Consumer Sentiment from the University of Michigan lost 1.7 points to a seasonally adjusted reading of 95.1 (1966Q1=100). Whereas the measure remained 3.9 points above its September 2016 reading, it has stayed within a tight four-point range since February. The current conditions index added 8/10ths of a point to 111.7 (September 2016: 104.2) while the expectations index shed 3.3 points to 84.4 (September 2016: 82.7). The press release stated that confidence has remained resilient despite “a long list of issues that could have derailed the overall level of consumer confidence, including the unprecedented partisan divide, North Korea, Charlottesville, and the hurricanes.” The release also noted that the results were consistent with consumer spending growing “2.6% in 2017 and in the 1st half of 2018.”
 Durable goods orders rebounded in August. The Census Bureau estimates new orders for manufactured durable goods grew 1.7 percent during the month to a seasonally adjusted $232.8 billion. Nearly every month, the headline number is heavily influenced by transportation goods orders (and, specifically, aircraft orders), which tend to be quite volatile month-to-month. New orders for civilian aircraft surged 44.8 percent, leading to a 4.9 percent overall gain in transportation goods (new orders for automobiles increased 1.5 percent). Net of transportation goods, new orders grew 0.2 percent during the month, which included gains for communications equipment (+4.0 percent), machinery (+0.3 percent), primary metals (+0.3 percent). On the flipside, orders fell for computers (-1.3 percent), fabricated metal products (-0.4 percent), and electrical equipment/appliances (-0.1 percent). New orders for non-defense durable goods gained 2.2 percent during August while those of non-defense, non-aircraft capital goods (a proxy for business investment) rose 0.4 percent.
Other U.S. economic data released over the past week:
– Jobless Claims (week ending September 23, 2017, First-Time Claims, seasonally adjusted): 272,000 (+12,000 vs. previous week; +19,000 vs. the same week a year earlier). 4-week moving average: 277,750 (+8.9% vs. the same week a year earlier).
– New Home Sales (August 2017, New Residential Sales, seasonally adjusted annualized rate): 560,000 (-3.4% vs. July 2017, -1.2% vs. August 2016).
– Pending Home Sales (August 2017, Index (2001=100), seasonally adjusted): 106.3 (-2.6% vs. July 2017, -2.6% vs. August 2016).
– Agricultural Prices (August 2017, Prices Received by Farmers (Index: 2011=100)): 93.4 (-2.0% vs. July 2017, +4.1% vs. August 2016).
The opinions expressed here are not necessarily those of Kevin’s current and previous employers. No endorsements are implied.
