
The U.S. economy ended 2016 a bit stronger than previously thought, while consumer sentiment continued to brighten for many Americans during March. Here are the 5 things we learned from U.S. economic data released during the week ending March 31.
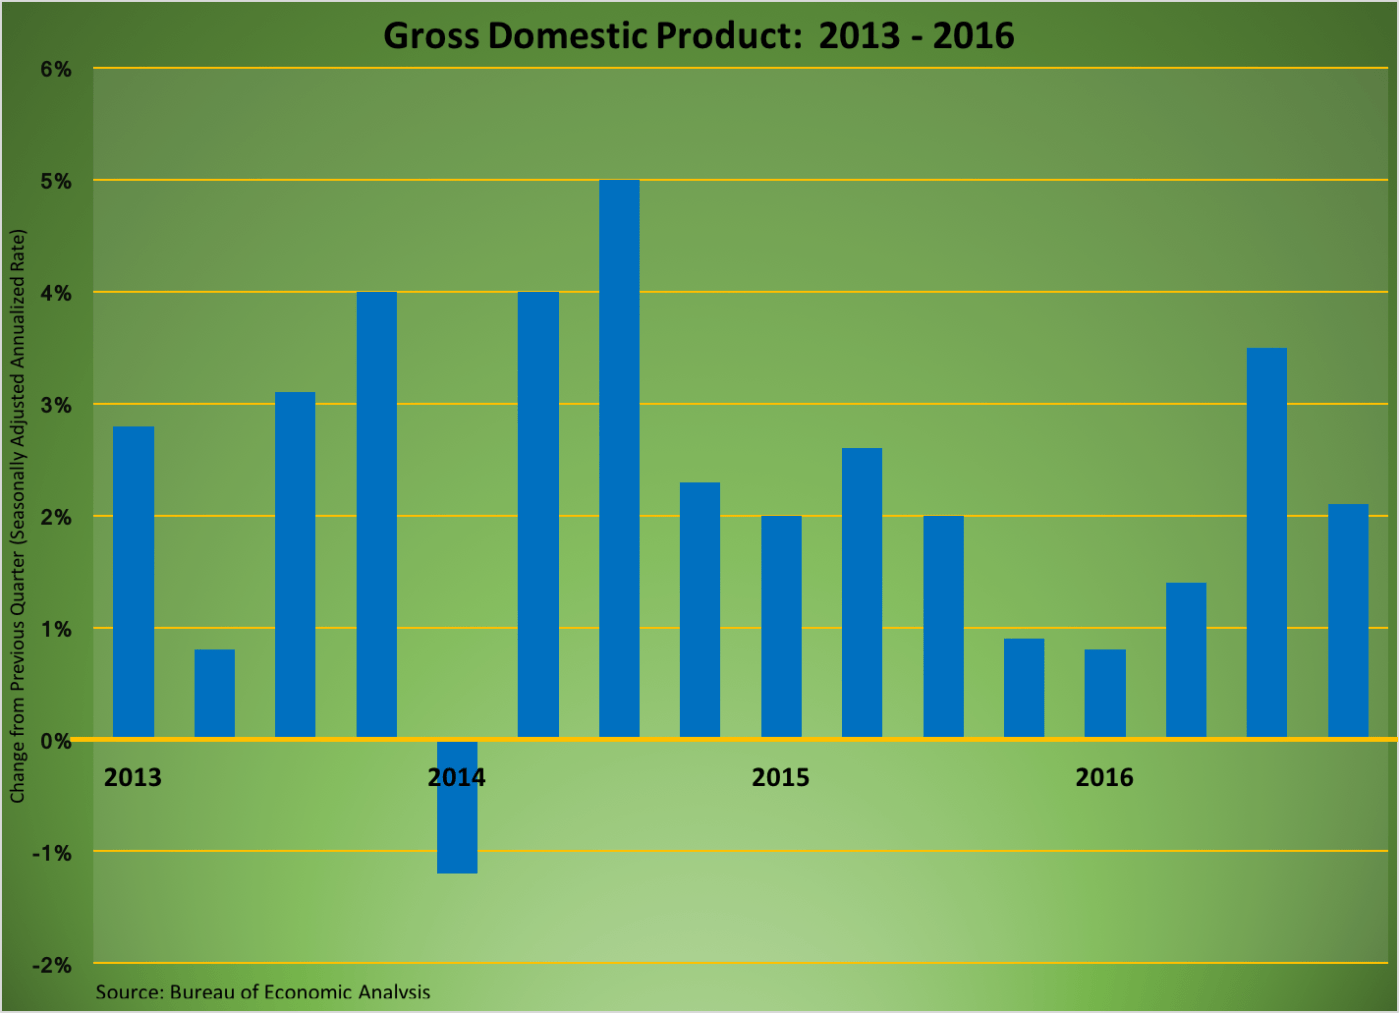
 The “final” revision to Q4 2016 GDP indicates a slightly healthier economy that previously believed. The Bureau of Economic Analysis now places the seasonally adjusted annualized growth rate of the Gross Domestic Product (GDP) at a solid, if not particularly great, +2.1 percent. This was an improvement from the 1.9 percent increase previously reported over the past two months, mainly the result of higher estimates for personal spending and private inventory accumulation. What did not change was that the GDP components that positively contributed to economic growth during the quarter were personal consumption expenditures (adding 240-basis points to GDP growth), the change in private inventories (+101-basis points), residential fixed investment (+35-basis points), nonresidential fixed investment (+11-basis points), and government expenditures (+3-basis points). Holding back GDP growth were a rise in imports (costing 127-basis points in GDP growth) and a decline in exports (costing 55-basis points in GDP growth). Meanwhile, corporate profits inched up 0.5 percent during Q4 to a seasonally adjusted annualized rate of $2.150 trillion (+9.3 percent vs. Q4 2015). We will get the first estimate of Q1 2017 GDP on April 28.
 “Real” personal spending slipped for a second straight month. The Bureau of Economic Analysis reports that personal consumption expenditures (PCE) adjusted for inflation (using 2009 chained dollars) inched down 0.1 percent during February, leaving the measure of consumer spending 2.6 percent above that of a year earlier. Real spending on goods increased 0.1 percent during the month, with expenditures on durable goods off 0.1 percent and that on nondurables up 0.1 percent. Moderate winter weather lowered demand for utilities, which led to a 0.1 percent decline in spending on services. Over the past year, real spending on goods has grown 4.4 percent while that on services was up 1.8 percent. Without price adjustments, personal spending increased 0.1 percent during the month, funded by a 0.4 percent increase in nominal personal income. Disposable personal income grew 0.3 percent, with the gain shrinking to 0.2 percent after adjustments for inflation. Real disposable income was 2.3 percent above that of February 2016. The saving rate grew by 2/10ths of a percentage point to +5.6 percent. Finally, inflation moves ever slowly closer to the Federal Reserve’s two percent target rate. The PCE deflator, a measure of inflation, grew 0.1 percent during February and was up 2.1 percent from a year earlier. Net of energy and food, the PCE deflator increased 0.2 percent during February with a 12-month comparable of +1.8 percent.
 Consumers grew more confident during March. The Conference Board’s Consumer Confidence Index surged 9.5 points during the month to a seasonally adjusted reading of 125.6 (1985 = 100). This was measure’s best reading in more than 16 years. Survey respondents’ views of both current and future business conditions improved significantly from February, with the present conditions index adding 9.7 points to 143.1 and the expectations index rising by 9.9 points to 143.1. A closer glance at the data finds 32.2 percent of respondents characterizing current business conditions as “good” (versus 12.9 percent saying they were “bad”) while 31.7 percent claimed that jobs were “plentiful” (versus 19.5 percent saying they were “hard to get”). The press release noted that “consumers feel current economic conditions have improved over the recent period, and their renewed optimism suggests the possibility of some upside to the prospects for economic growth in the coming months.”
While the University of Michigan’s Index of Consumer Sentiment added 6/10ths of a point to a seasonally adjusted reading of 96.9 (1966Q1 = 100), the press release noted a sharp partisan divide in views of economic conditions. “Democrats expect an imminent recession, higher unemployment, lower income gains, and more rapid inflation, while Republicans anticipate a new era of robust growth in incomes, job prospects and lower inflation.” Only a quarter of Democrats expect their personal finances will improve over the next five years, compared to 83 percent of Republicans who are anticipating the same. Two-thirds of Democrats expect “renewed economy-wide downturns” while only 13 percent of Republicans fear of the same. During the month, the current conditions index added 1.7 points to a reading of 113.2 (+7.2 percent versus March 2016) while the expectations index held steady at 86.5 (+6.1 percent versus March 2016).
 Pending home sales sharply increased in February. The National Association of Realtors’ Pending Home Sales Index jumped 5.5 percent during the month to a reading of 112.3 (2001 = 100). This was up 2.6 percent from a year earlier and the second-highest reading since 2006 (the highest reading having occurred last April). The index, which measures the number of contracts signed to purchase a previously owned home, grew during the month in all four Census regions: Midwest (+11.4 percent), South (+4.3 percent), Northeast (+3.4 percent), and West (+3.1 percent). The press release links the rise in the index to “[t]he stock market’s continued rise and steady hiring in most markets,” along with moderate winter weather bringing homebuyers into the market.
 Agricultural prices rose in February. The U.S. Department of Agriculture reports that its prices received by farmers index increased 6.1 percent during the month to a reading of 91.7 (2011 = 100). This was 0.9 percent below the February 2016 reading. Crop prices jumped 10.0 percent during the month, led by significant prices increases for vegetables/melons, fruit/tree nuts, and grains/oilseed. The measure has risen 3.5 percent over the past year. Prices for livestock production slipped 0.5 percent during February and was 3.2 percent below their year ago readings. Prices fell for poultry/eggs and dairy but increased for meat animals.
Other U.S. economic data released over the past week:
– Jobless Claims (week ending March 25, 2017, First-Time Claims, seasonally adjusted): 258,000 (-3,000 vs. previous week; -17,000 vs. the same week a year earlier). 4-week moving average: 254,250 (-5.1% vs. the same week a year earlier).
The opinions expressed here are not necessarily those of Kevin’s current and previous employers. No endorsements are implied.
