

Repeating a monthly trend that had started back in October 2010, employers added workers in December. Survey data also indicated that both the manufacturing and service sectors grew at the end of 2016. Here are the 5 things we learned from U.S. economic data released during the week ending January 6.
 2016 ended with the pace of job creation slowing slightly. Per the Bureau of Labor Statistics, nonfarm payrolls expanded by 156,000 jobs during December. This was below the 204,000 jobs created in November but represented the 75th straight month with job growth. Private sector employers added 144,000 jobs during the month, led by gains in health care/social assistance (+63,300), leisure/hospitality (+24,000), manufacturing (+17,000), professional/business services (+15,000), transportation/warehousing (+14,700), and government (+12,000). Average hourly wages hit $26.00, 2.9% above year ago hourly wages. The average number of hours worked held steady at 34.3 hours (December 2015: 34.5), so median weekly earnings were “only” up 2.3% from a year earlier to $891.90.
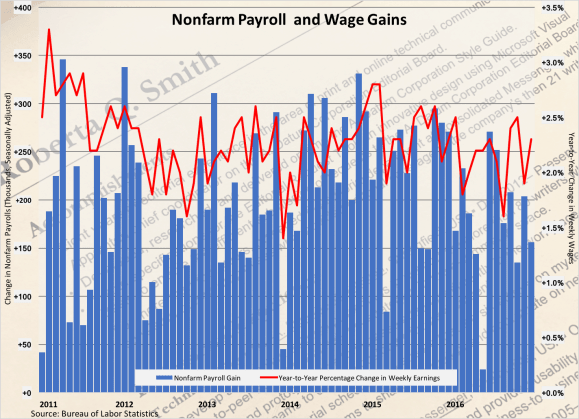
The separate survey of households indicates the unemployment rate edged up 1/10th of a point during December to 4.7% (December 2015: 5.0%). 184,000 people entered the labor market during the month, leading to a 1/10th of a point gain in the labor force participation rate to 62.7% (matching the year ago reading). The median length of unemployment inched up 1/10th of a week to 10.3 weeks (December 2015: 10.7 weeks) while the count of part-time workers seeking a full-time job slipped by 61,000 to 5.598 million (December 2015: 6.057 million). Finally, the broadest measure of labor underutilization published by the BLS (the U-6 series) dropped to another post-recession low at 9.2% (December 2015: 9.9 weeks).
 Purchasing managers indicate both the manufacturing and service sectors of the economy expanded during December. The Institute for Supply Management’s Purchasing Managers Index (PMI) added 1.5 points during the month to a seasonally adjusted reading of 54.7, its best reading for 2016. This was the 4th straight month in which the PMI was above a reading of 50.0, indicative of an expanding manufacturing sector. 3 of 5 components of the PMI improved from their November marks: new orders (+7.2 points to 60.2), production (+4.3 points to 60.3), and employment (up 8/10ths of a point to 53.1). Declining were index components that track supplier deliveries (-2.8 points to 52.9) and inventories (-2.0 points to 47.0). 11 of 18 tracked manufacturing industries expanded during the month, led by petroleum/coal products and primary metals. The press release noted that “forward-looking comments from the panel [were] largely positive.”
Meanwhile, the headline index from the ISM’s Non-Manufacturing Report on Business was unchanged for the month as it remained its 2016 high of 57.2. This was the measure of service sector activity 89th straight month above a reading of 50.0. Of the measure’s 4 components, only that for new orders (+4.6 points to 61.6) improved during the month. The index for employment lost 4.4 points (to 53.8) while the measure of business activity/product slipped 3/10ths of a point to 61.4. The supplier deliveries measure remained at 52.0. 12 of 18 tracked nonmanufacturing industries expanded during the month, including mining, retail trade, and finance/insurance. The press release indicated that survey participants’ comments were “mostly positive about business conditions and the overall economy.”
 A big drop in orders for civilian aircraft pulled down factory orders in November. The Census Bureau reports the value of new orders for manufactured goods fell 2.4% during the month to a seasonally adjusted $458.3 billion (-0.3% vs. November 2015). This was the first drop in new orders after 4 straight months of increases. The primary culprit for the decline was the 73.8% freefall in orders for civilian aircraft (note that aircraft sales tend to be very volatile month-to-month). Orders for all transportation goods fell 13.2% during the month, even as orders for motor vehicles gained 1.3%. Net of transportation goods, factory orders edged up 0.1% during November. This included month-to-month order gains for primary metals (+2.2%), machinery (+1.4%), computers/electronics (+0.5%), and furniture (+0.4%). Nondefense capital goods orders excluding aircraft—a proxy measure of business investment—grew 0.9% during the month.
 Auto manufacturers ended a record year with strong sales in December. Sales of light vehicles rose 3.1% during the month to a seasonally adjusted annualized rate (SAAR) of 18.43 million units. This was 5.2% above the December 2015 sales pace. Consumers continued to show an increased preference for SUVs and trucks over automobiles. Sales of light trucks and SUVs grew 4.3% during the month to 11.17 million units (+11.4% vs. December 2015). Sales of automobiles increased a less robust 1.4% during the month to 7.26 million units. This was 3.2% below the December 2015 sales pace. Autodata Corporation’s analysis places vehicles sales at 17.550 million units for all of 2016, up 0.4% from what had previously been the all-time highest sales pace in 2015.
 Construction spending enjoyed broad-based gains in November. The Census Bureau estimates the seasonally adjusted annualized value of construction put into place grew 0.9% during the month to $1.192 trillion. This was up 4.1% from a year earlier and was its highest point since April 2006. Private sector construction spending jumped 1.0% during November to a SAAR of $892.8 billion (+4.6% vs. November 2015). Residential construction gained 1.0% during the month while nonresidential spending increased 0.8%. (The 12-month comparables were +3.0% and +6.4%, respectively.) Public sector spending gained 0.8% during November to hit a SAAR of $282.5 billion (+2.6% vs. November 2015).
Other U.S. economic data released over the past week:
– Jobless Claims (week ending December 31, 2016, First-Time Claims, seasonally adjusted): 235,000 (-28,000 vs. previous week; -42,000 vs. the same week a year earlier). 4-week moving average: 256,750 (-7.1% vs. the same week a year earlier).
– FOMC minutes
The opinions expressed here are not necessarily those of Kevin’s current and previous employers. No endorsements are implied.
