
September featured moderate growth in manufacturing, existing home sales, and in leading economic indicators. Here are the 5 things we learned from U.S. economic data released during the week ending October 21.
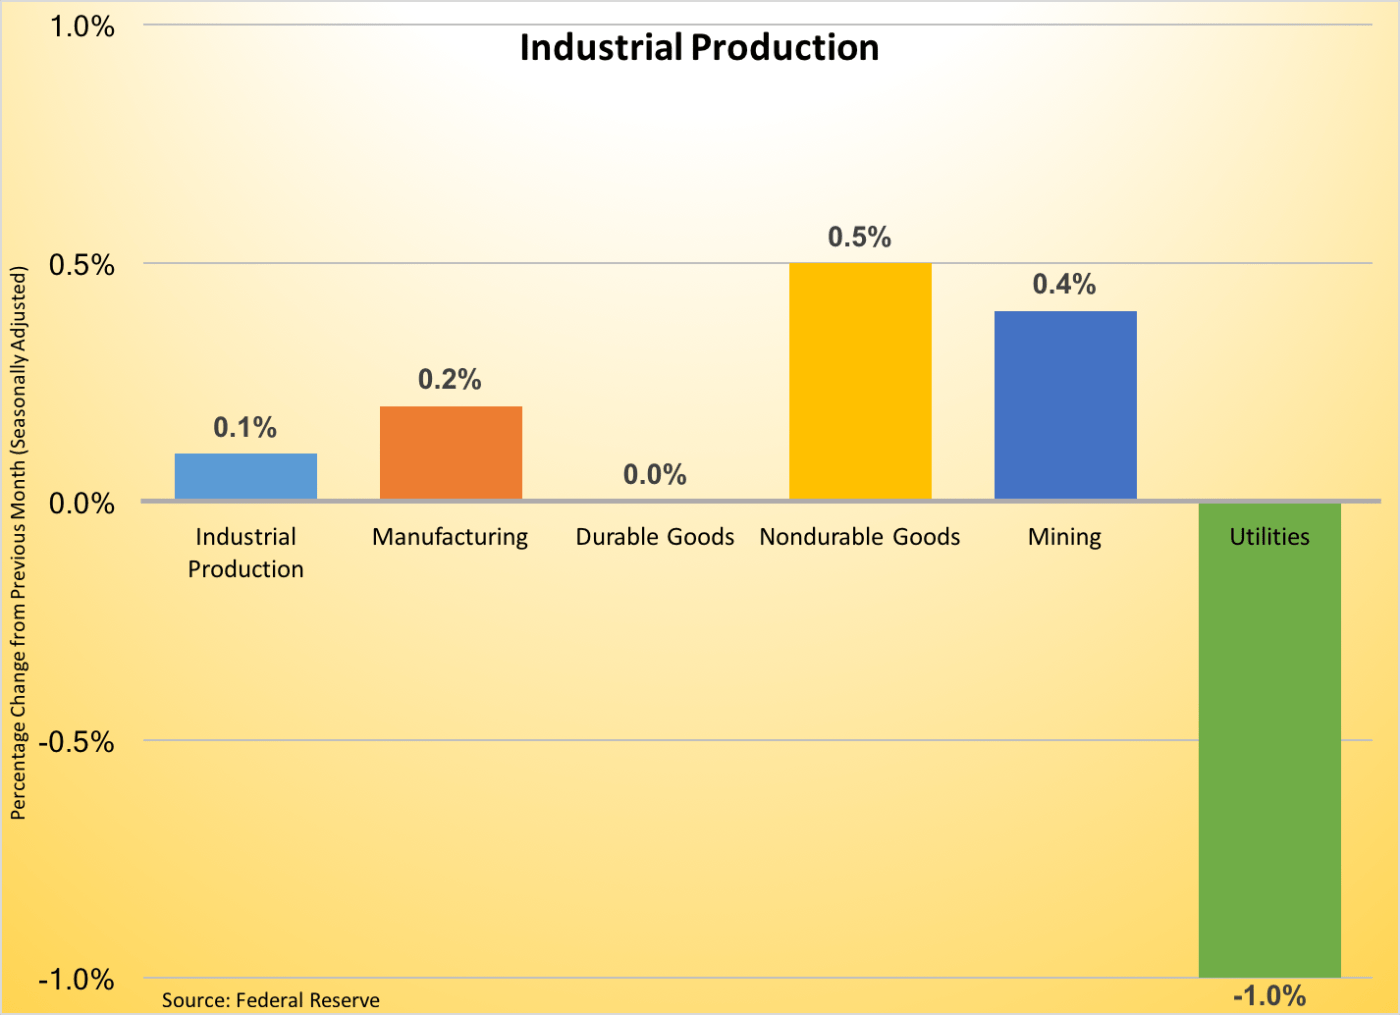
 September saw modest growth in manufacturing activity. The Federal Reserve reports that manufacturing sector output grew 0.2% on a seasonally adjusted basis during the month. With the small gain, manufacturing output matched that from September 2015. Durable goods production was unchanged for the month but output of nondurables grew 0.5%. The former was pulled down by falling production of primary metals, machinery, and aerospace/miscellaneous transportation equipment. In the case of the latter, all major categories of nondurable enjoyed output growth, with the largest percentage production gains seen for printing and petroleum/coal products. Overall industrial production inched up 0.1% but remained 1.0% below year ago levels. Utility output fell 1.0% during the month while mining production grew 0.4%. The latter increased during Q3, the 1st quarterly gain in mining output (which includes oil extraction) after 6 straight quarterly declines.
 Leading indicators signal moderate economic expansion over the near-term. The Leading Economic Index from the Conference Board added 3/10ths of a point during September to a seasonally adjusted 124.4 (2010=100). This followed a decline in August. 5 of the 10 components that make up the leading index pointed towards improved business activity; including, building permits, the interest rate spread, and jobless claims. The coincident index added 2/10ths of a point to 114.2, as all its components (nonfarm payrolls, person income transfer payments, manufacturing/trade sales, and industrial production) made positive contributions to the index. The lagging index grew by 2/10ths of a point to 122.3, with 4 of 7 index components making a positive contribution at the backward looking measure. The press release stated the gain in the leading index suggests the U.S. economy will grow at a “moderate pace” into early next year.
 Sales of previously owned homes grew in September following declines during the 2 prior months. Existing home sales were at a seasonally adjusted annualized rate of 5.47 million units, up 3.2% from August and 0.6% from a year earlier. The National Association of Realtors measure grew during the month in all 4 Census regions: Northeast (+5.7%), West (+5.0%), Midwest (+3.9%), and South (+0.9%). Only the Midwest and West, however, had positive 12-month comparables in terms of sales activity. Inventories of unsold homes remained tight—there were 2.04 million previously owned homes available for sale at the end of September, up 1.5% for the month but 6.8% below year ago inventory levels. The resulting 4.5 month supply prompted a 5.6% gain in the median sales price versus a year earlier (to $234,200). NAR’s press release noted that a third of home sales were from first-time home buyers, the highest percentage of first-time buyers in over four years.
 Housing starts slowed in September, centered with multi-family units. The Census Bureau estimates housing starts were at a seasonally adjusted annualized rate of 1.047 million units. This was 9.0% decline for the month and 11.9% below year ago levels. The pace of starts for multi-family units (5+ units) plummeted 38.9% for the month and was 42.5% below year ago levels, while starts of single-family units jumped 8.1% during September to 783,000 units (SAAR, +5.4% vs. September 2015). Permit activity suggests that starts activity should grow over the intermediate term. The 1.225 million issued construction permits (SAAR) was 6.3% above the previous month’s pace and was 8.5% over September 2015 levels. The annualized count of permits was up 4.4% for single-family units and was 17.2% above September 2015’s pace for permits for 5+ unit properties. The rate of completions, however, slowed to their lowest level for 2016: down 8.4% for the month to 951,000 units.
 Energy, shelter, and medical commodities sparked higher consumer prices in September. The Bureau of Labor Statistics reports that the Consumer Price Index (CPI) grew a seasonally adjusted 0.3% during the month, its largest single-month increase since April. Prices for food held steady during the month, while energy CPI jumped 2.9%. The latter, which was its largest monthly gain since April, resulted from a 5.8% surge in gasoline prices, a 2.4% hike in fuel oil prices, a 0.8% increase in prices for utility delivered natural gas, and a 0.7% gain in electricity price. Net of energy and food, core CPI increased 0.1% (down from August’s 0.3% gain). Core commodity prices slipped 0.1% while those for core services increased 0.2. Prices grew for medical care commodities (+0.6%) and shelter (+0.2%) but fell for apparel (-0.7%), used cars (-0.3%), and new cars (-0.1%). Headline CPI was increased 1.5% over the past year while the core index was 2.2% above its September 2015 level.
Other data released over the past week that you might find of interest:
– Jobless Claims (week ending October 15, 2016, First-Time Claims, seasonally adjusted): 260,000 (+13,000 vs. previous week; -5,000 vs. the same week a year earlier). 4-week moving average: 251,750 (-6.0% vs. the same week a year earlier).
– Housing Market Index (September 2016, Index (>50 = “good” housing market), seasonally adjusted): 63 (August 2016: 65, September 2015: 65).
– State Employment (September 2016, Nonfarm Payrolls, Seasonally Adjusted): Vs. August 2016: Payrolls grew in 14 states, contracted in 3 states and essentially was unchanged in 33 states and in the District of Columbia. Vs. September 2015: Payrolls grew in 35 states and in the District of Columba, fell in 1 state and was essentially unchanged in 14 states.
– Beige Book
– Treasury International Capital Flows (August 2016, U.S. Securities Purchased by Foreign Investors): +$30.4 billion (vs. July 2016: +$71.4 billion, vs. August 2015: -$28.1 billion).
The opinions expressed here are not necessarily those of Kevin’s current and previous employers. No endorsements are implied.
