
Even with a lower estimate for Q2 GDP, economic activity appears to have picked up in July. Here are the 5 things we learned from U.S. economic data released during the week ending August 26.
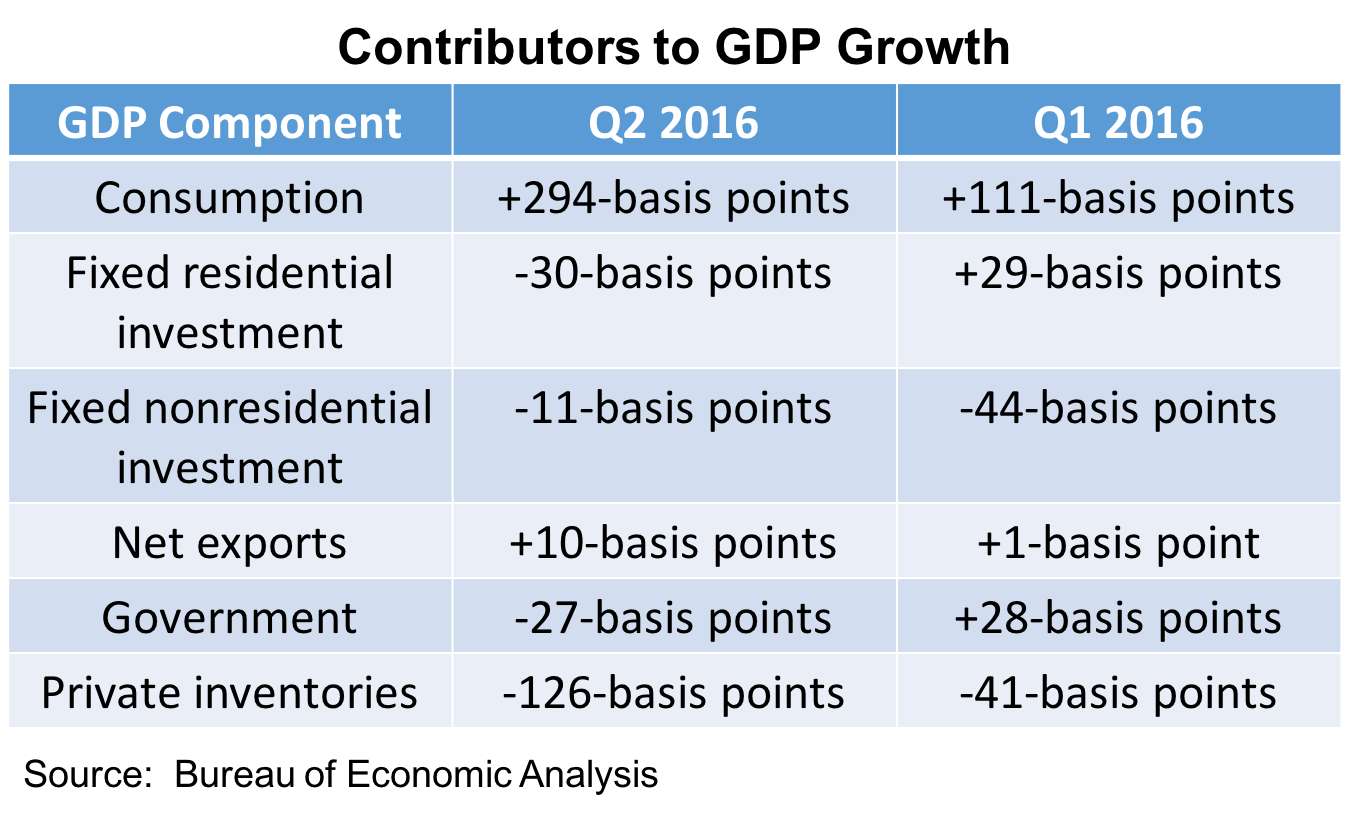
 A small downward revision in Q2 GDP growth. The Bureau of Economic Analysis now says Gross Domestic Product (GDP) grew at a tepid seasonally adjusted annualized rate (SAAR) of +1.1%. This was off from the +1.2% annualized gain reported a month ago. The downward revision was the product of smaller than previously believed levels of state/local government spending and slower private inventory accumulation. As we saw with last month’s report, Q2 GDP growth was largely the result of higher consumption, which added 294-basis points to the rate of economic growth, with net exports the only other positive contributor to GDP growth. Drags on economic activity were fixed residential and nonresidential investment, private inventory accumulation, and government expenditures. The Personal Consumption Expenditures (PCE) deflator, a measure of inflation, was at +2.0% (SAAR) during the quarter. The core PCE deflator, which removes both energy and food from the analysis, was at +1.8%. Corporate profits (after adjustments for inventory valuation and capital consumption) slumped 1.2% during the quarter and was 4.9% below year ago levels. Look for another Q2 GDP revision next month.
 July was the best month for economic activity in a year, at least according to one measure. The Chicago Fed National Activity Index (CFNAI) added 22-basis points during the month to a seasonally adjusted reading of +0.27. The Federal Reserve Bank of Chicago’s index of 85 economic indicators has not been this high since July 2015. Most of the gain came from indicators associated with production/income, with its contribution to the CFNAI increasing by 16-basis points during the month to +0.23. Also making positive contributions were indicators associated with employment (+0.09) and sales/orders (+0.01), while indicators tied to consumption/housing made a small negative contribution (-0.06). 53 of 85 individual indicators made a positive contribution to the CFNAI, as 49 of CFNAI’s indicators improved from their June readings. The 3-month moving average for the CFNAI added 9-basis points to -0.10. While this was the moving average has been negative territory for 18 consecutive months (which is indicative economic growth below its historic average), this was the moving average’s best reading since February.
 Tight inventories slowed existing homes during July, even as new home sales hit another post-recession high. The National Association of Realtors reports that sales of previously owned homes dropped 3.2% during the month to a seasonally adjusted annualized rate (SAAR) of 5.39 million units. While this was off 1.6% from a year earlier, the SAAR for home sales remained above 5 million units every month in 2016. Sales fell in 3 of 4 Census regions on both a month-to-month (Northeast, Midwest and South) and year-to-year (Northeast, South, and West) basis. There were 2.13 million homes available for sale at the end of July (+0.9% vs. June 2016 and -5.8% vs. July 2015), equivalent to a tight 4.7 month supply. The median sales price of $244,100 was 5.3% above year ago levels. The press release linked what it called the “considerable sales slump” during the month to a “severely restrained inventory” and its resulting impact on affordability.
Meanwhile, new home sales jumped 12.4% during July to a SAAR of 654,000 units. This was up 31.3% from the July 2015 sales pace and its highest point for the Census Bureau measure since the fall of 2007. Sales improved in 3 of 4 Census regions during the month (the 1 outlier, the West, had sales matching its June pace). Sales were up by double-digit percentages on a year-to-year basis in all 4 regions. New home inventories tightened further—there were 233,00 new homes available for sale at the end of the July, which represented a mere 4.3 month supply.
 July was a good month for durable goods orders. The Census Bureau estimates the value of manufactured durable goods grew by 4.4% during the month to a seasonally adjusted $228.9 billion. Even with the gain, this was 3.3% below year ago levels. A part, but not all, of the increase was tied to a bounce in the typically volatile transportation sector (+10.5%), with big gains in both civilian (+89.9%) and defense (+20.3%) aircraft. Net of transportation goods, new orders grew 1.5%. There were higher new orders for computers/electronics (+3.6%), electrical equipment/appliances (+2.6%), machinery (+1.6%), fabricated metal products (+1.5%), and primary metals (+1.4%). A proxy for business investment—new orders for nondefense, non-aircraft capital goods—increased 1.6% during July. Durable goods shipments edged up 0.2% during the month to $232.9 billion (-2.2% vs. July 2015). Non-transportation durable goods shipments were up 0.4% during the month. Unfilled orders slowed 0.1% while inventories expanded for the 1st time in 7 months with a 0.3% increase.
 One measure of consumer confidence takes a very small step back in August. The Index of Consumer Sentiment from the University of Michigan slipped 2/10ths of a point during the month to a seasonally adjusted index reading of 89.8 (1966Q1 = 100). This was 6/10ths of a point below the preliminary August reading published just a few weeks ago and off 2.1 points from the final August 2015 mark. The sentiment of current and expected conditions moved in different directions during the month. The current conditions index lost 2.0 points to a reading of 107.0 (August 2015: 105.1) while the expectations index added 9/10ths of a point to 78.7 (August 2015: 83.4). Expectations for inflation slipped during the month—1-year expectations shed 2/10ths of a percentage point to +2.5% while 5-year expectations declined by a 1/10th of a point also to +2.5%. The press release stressed that even with the small drop, “consumer confidence remains at a reasonably high level.” Further, they anticipate that the “strengthen in personal finances and low interest rates will maintain the growth in real consumption at 2.6% through mid 2017.”
Other data released over the past week that you might find of interest:
– Jobless Claims (week ending August 20, 2016, First-Time Claims, seasonally adjusted): 261,000 (-1,000 vs. previous week; -11,000 vs. the same week a year earlier). 4-week moving average: 265,250 (-3.7% vs. the same week a year earlier).
– FHFA House Price Index (June 2016, Purchase Only Index, seasonally adjusted): +0.2% vs. May 2016, +5.6% vs. June 2015.
The opinions expressed here are not necessarily those of Kevin’s current and previous employers. No endorsements are implied.
