
April was the slowest month in terms of 2016 job creation while the trade deficit shrinks in the face of weakness in consumer goods imports. Here are the 5 things we learned from U.S. economic data released during the week ending May 6.
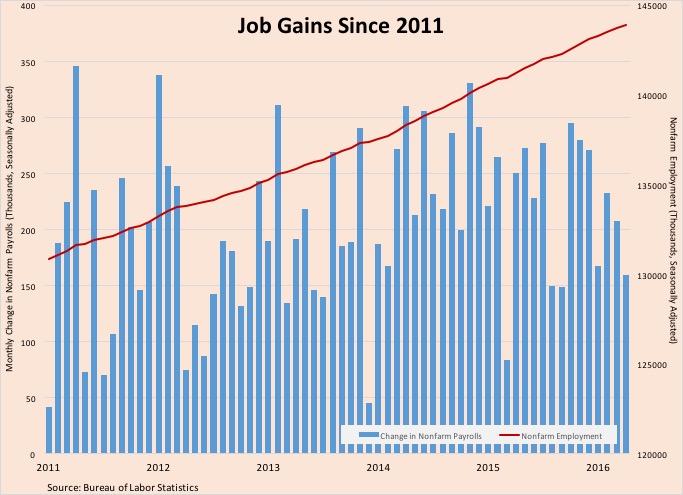
 Employers added fewer jobs in April than they had in any other month since last September. The Bureau of Labor Statistics reported that nonfarm payrolls expanded by a seasonally adjusted 160,000 jobs during the month. The BLS also lowered its estimates of February and March job gains by 12,000 and 7,000, respectively. This was the 67th straight month of job gains. Private sector employers added 171,000 jobs—the service sector added 174,000 workers while the goods producing side shed 3,000 jobs. The largest payrolls gains occurred in professional/business services (+65,000), health care/social assistance (38,200), leisure/hospitality (+22,000) and financial activities (+20,000).
  Meanwhile, private sector average weekly hours worked inched up 1/10th of an hour to 34.5. The resulting average weekly earnings of $880.79 was up 2.5% from a year earlier.
A separate survey of households kept the unemployment rate of 5.0% (vs. 5.4% in April 2015). Reversing recent positive trends, 362,000 people left the labor force during April and the labor force participation rate dropped by 2/10ths of a percentage point to 62.8%, near its multi-decade low. The median length of unemployment held steady at 11.4 weeks (April 2015: 11.6 weeks), while the percentage of unemployed workers without a job for at least half a year fell to a post-recession low of 25.7%. Also falling to a post-recession low is the count of people with part-time work that were seeking a full-time job, off 161,000 to 5.962 million. Finally, the broadest measure of labor underutilization by the BLS (the U-6 series) slipped 1/10th of a percentage point to 9.7%, matching February’s reading and that was its post-recession low.
 The trade deficit narrowed in March as import activity drops. The Census Bureau and the Bureau of Economic Analysis estimate that the trade balance was at a seasonally adjusted -$40.4 billion, down $6.6 billion from February and the smallest deficit in 13 months. Import activity slowed by $8.0 billion to $217.1 billion while exports dropped by $1.6 billion to $176.6 billion. Imports were 9.1% below year ago level while exports were off 5.4% from March 2015 readings. The goods deficit narrowed by $6.0 billion to -$58.5 billion while the goods surplus expanded by $0.5 billion to +$18.1 billion. Pulling down the goods deficit was a $5.1 billion decline consumer goods imports (including those for toys/games/sporting goods and cotton apparel/household goods) and a $1.6 billion drop in capital goods imports. The “real” goods deficit, based on 2009 chained dollars, contracted by $5.8 billion to -$57.4 billion (-13.6% vs. March 2015). The U.S. had its largest nominal goods deficits during the month with China, the European Union, Germany, Japan and Mexico.
 The defense sector drives manufacturing gains in March, but factory orders remain well below the year ago pace. New orders for manufactured goods grew for the 2nd time in 3 months with a 1.1% increase to a seasonally adjusted $458.4 billion, according to the Census Bureau. Even with the recent gains, this was 4.2% below year ago levels. As we saw with the previous week’s durable goods report, most of the gain in factory orders was for defense aircraft, the orders for which jumping 65.3%. Net of defense, new factory orders grew 0.2%. Other sectors seeing order gains were nondurable goods (+1.5%), primary metals (+0.6%) and machinery (+0.5%). Falling were orders for electrical equipment/appliances (-2.6%), fabricated metal products (-1.3%) and computers/electronics (-0.7%). Shipments grew for the 1st time after 8 straight months of decline (+0.5%) to $464.7 billion. Unfilled orders dropped for the 3rd time in 4 months with a 0.1% decline to $1.183 trillion while inventories expanded for the 1st time after 8 monthly declines with a 0.2% gain to $635.1 billion.
 Purchasing managers say manufacturing barely grew during April while the service sector enjoyed healthier gains. The Purchasing Managers’ Index (PMI) from the Institute for Supply Management lost a full point to a seasonally adjusted 50.8. This was the 2nd straight month in which the index was above a reading of 50.0—the threshold between a growing and contracting manufacturing sector—but the decline means the pace of expansion was slower than that of March. 4 of 5 PMI components declined during the month: new orders (55.8), production (54.2), supplier deliveries (49.1) and inventories (45.5). The employment index added 1.1 points but remained in contractionary territory of 49.2. 11 of 18 tracked manufacturing industries expanded during the month, led by wood products, printing, paper products, and plastics/rubber.
Meanwhile, the headline index of ISM’s measure of service sector activity added 1.2 points to seasonally adjusted reading of 55.7, its highest point of the year and the 75th straight month above a reading of 50.0. 2 of 4 index components improved during the month: new orders (59.9, its best since last October) and employment (53.0, its highest point since last December). The measure for business activity shed a full point to 58.8 while the supplier deliveries measure held steady at 51.0. 13 of 18 tracked service sector industries expanded during April, led by information, management of companies and accommodation/food services. The press release noted that survey respondents’ comments “reflect optimism about the business climate and the direction of the economy.”
 Private construction spending grew for a 2nd straight month in March. The Census Bureau estimates the value of construction put into place was at a seasonally adjusted annualized rate of $1.114 trillion, up 0.3% from February 2016 and 8.0% from a year earlier. Private construction spending jumped 1.1% for the month to a SAAR of $842.3 billion (+8.5% vs. March 2015 levels). This included a 1.6% jump in residential construction spending as new multi-family unit residential construction spending surged 5.6% (new single-family home spending was flat during the month). Public sector spending contracted 1.9% to a SAAR of $295.2 billion, which was nevertheless still 6.7% above year ago levels.
Other data released over the past week that you might find of interest:
– Jobless Claims (week ending April 30, 2016, First-Time Claims, seasonally adjusted): 274,000 (+17,000 vs. previous week; +7,000 vs. the same week a year earlier). 4-week moving average: 258,000 (-7.1% vs. the same week a year earlier).
– Productivity (1st quarter 2016, Nonfarm Labor Productivity, seasonally adjusted annualized rate): -1.0% vs. Q4 2015; +0.6% vs. Q1 2015.
– Vehicle Sales (April 2016, seasonally adjusted annualized rate): 17.42 million (+5.1% vs. March 2016; +4.0% vs. April 2015).
– Consumer Credit (March 2016, Outstanding Non-Real Estate Credit Balances, seasonally adjusted)L $3.592 trillion (+$29.7 billion vs. February 2016, +6.6% vs. March 2015).
The opinions expressed here are not necessarily those of Kevin’s current and previous employers. No endorsements are implied.
