
There was a small bump in retail sales and near-record numbers of job openings. And yet, import and export price continue to fall. Here are the 5 things we learned from U.S. economic data released during the week ending February 12.
 A modest sales gain during January and an upward revision for December paints a slightly better retail picture. The Census Bureau estimates sales for retail and food services were at a seasonally adjusted $402.2 billion, up 0.2% for the month and 3.4% from a year earlier. Further, the Census Bureau upwardly revised its estimate of December sales from a 0.1% drop to a 0.2% gain. January’s sales were boosted in part by a 0.5% gain in activity at car dealers.
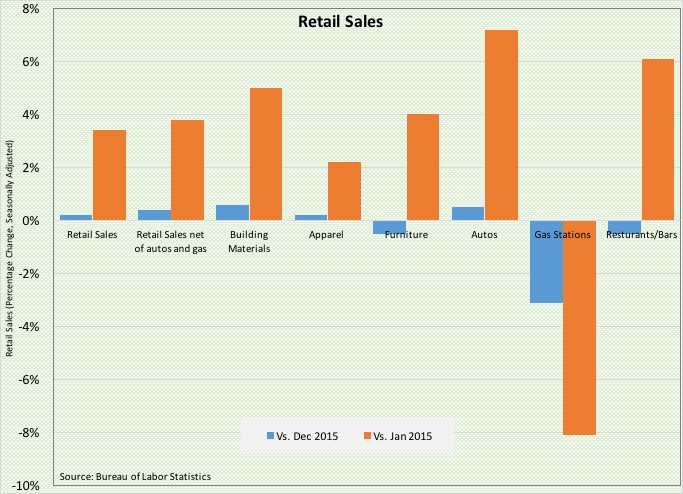
 After removing sales at both car dealers and gas stations (where low gas prices pushed down sales 3.1%), core retail sales grew 0.4% during the month and were 3.8% above year ago levels. Sales jumped at nonstore retailers (+1.6%), general merchandisers (+0.8%), building material retailers (+0.6%), food/beverage stores (+0.5%) and clothing retailers (+0.2%). Sales slowed at sporting goods/hobby stores (-2.1%), furniture retailers (-0.5%) and restaurant/bars (-0.5%).
 Employers have many ‘help wanted’ signs in their windows. According to the Bureau of Labor Statistics, there were a seasonally adjusted 5.607 million job openings at the end of December. This was up 261,000 from November, 15.0% above December 2014 levels and near the all-time high count achieved just a few months earlier. Private sector employers had 5.086 million job openings, up 15.7% from a year earlier, with the largest positive 12-month comparables seen for construction (+47.9%), health care/social assistance (+21.4%), manufacturing (+17.7%), retail (+9.3%) and leisure/hospitality (+8.4%). As we have seen throughout most of the economic recovery, the growth in job openings was not matched by actual hiring activity. The seasonally adjusted count of hires of 5.361 million was up 105,000 from November and 2.3% from a year earlier. The biggest year-to-year gains in hires were in accommodations/food services (+13.7%), professional/business services (+7.1%) and health care/social assistance (+3.2%). A consistent sign of worker confidence is the continued growth in voluntary quits, which were up 12.5% from a year earlier to 3.055 million (another post-recession high). Meanwhile, layoffs were 6.8% below year ago levels at 1.607 million.
 Import Prices fell for the 7th straight month in January. The Bureau of Labor Statistics reports that import prices dropped 1.1% during the month and were 6.2% below January 2015 levels. Prices for fuel imports plummeted 12.4% (its largest drop in 5 months) as prices for imported gasoline and natural gas fell 13.4% and 3.2%, respectively. But deflation was not just associated with the freefall in energy prices as nonfuel import prices also slumped 0.2%, including price drops for nonfuel industrial supplies/materials and capital goods. Rising were prices for imported food, automobiles and consumer goods. Meanwhile, export prices dropped for the 9th time in 10 months with a 0.2% decline (-5.7% vs. January 2015), with price drops across most product categories (automobiles were a notable exception).
 Small business owner sentiment fell to a nearly 2-year low in December as their outlook for the future weakened. The Small Business Optimism Index from the National Federation of Independent Business lost 1.3 points to a seasonally adjusted reading of 93.9 (1986 = 100), it lowest reading since February 2014. Only 3 of the index’s 10 components improved from their December readings: current inventories (+2), whether it is a good time to expand (+2) and current job opening (+1). 6 other index components deteriorated during January: expectations for the economic to improve (-6), plans to increase employment (-4), expected real sales (-4), plans to expand inventories (-2), expected credit conditions (-1) and earnings trends (-1). Among other things, the press release links the weakness in small business owners’ outlook to “cartoonish” political races and the prospect of negative interest rates in the future.
 A Federal Reserve report finds a small improvement in labor market conditions during January. The Labor Market Conditions Index inched up 4/10ths of a point on a seasonally adjusted basis during the month, its smallest gain since last April. The index, based on 19 employment indicators including measures of employment, unemployment, wages and job openings, is used by Fed staff to assess labor market conditions. The index has been positive—indicating overall improvement in the labor market—for the past 10 months.
Other data released over the past week that you might find of interest:
– Jobless Claims (week ending February 6, 2016, seasonally adjusted): 269,000 (-16,000 vs. previous week; -33,000 vs. same week a year earlier). 4-week moving average: 281,250 (-2.5% vs. same week a year earlier).
– Business Inventories (December 2015, seasonally adjusted): $1.813 trillion (+0.1% vs. November 2015, +1.7% vs. December 2014).
– U.S. Government Budget (January 2016, Surplus/Deficit): +$55.2 billion (vs. -$14.4 billion in December 2015 and -$17.5 billion in January 2015). FY2016 deficit = -$160.4 billion (-17.4% vs. FY2015).
– University of Michigan Index of Consumer Sentiment (February 2016-Preliminary, Index (1966 Q1 = 100): 90.7 (-1.3 points vs. January 2016, -4.7 points vs. February 2015).
The opinions expressed here are not necessarily those of Kevin’s current and previous employers. No endorsements are implied.
