
The Fed decides to hold steady as we learn that GDP sputtered at the end of 2015 and durable goods orders plummeted in December. Here are the 5 things we learned from U.S. economic data released during the week ending January 29.
 After making a move in December, the Federal Reserve declines making another hike in January. The statement released by the Federal Open Market Committee, following its 2-day meeting last week, noted that “labor market conditions improved” while “economic growth slowed” at the end of last year. Housing, consumer spending and business investment improved as 2015 was wrapping up while net exports and business inventory builds each softened. Finally, inflation remained below the Fed’s 2-percent target rate. These findings, along with the recent turbulence seen with China and energy commodities, led the committee to keep the federal funds target rate at between 0.25% and 0.50%, which it states is “accommodative, thereby supporting further improvement in labor market conditions and a return to 2 percent inflation.” The policy statement also reaffirmed the FOMC members’ belief that rate hikes will likely only be “gradual,” keeping rates below their historic long-term normal levels. The decision was unanimously agreed upon by the FOMC voting members. The FOMC meets next in mid-March.
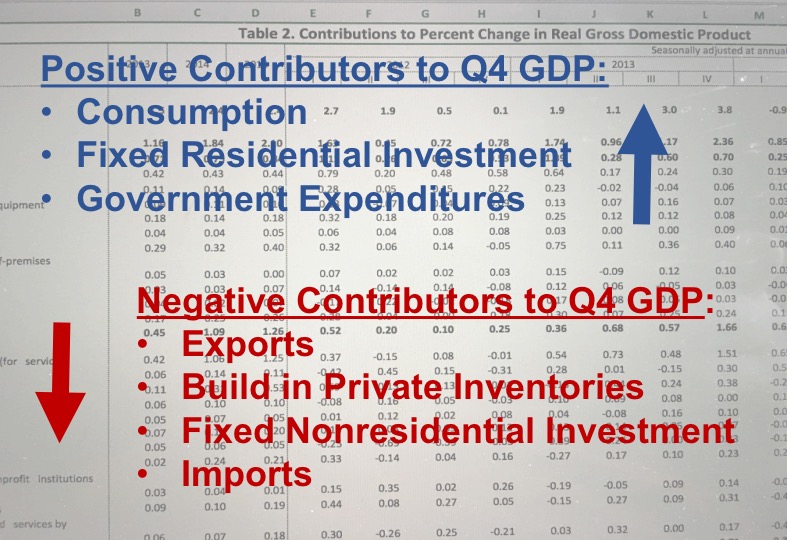
 Q4 GDP was just like Q1 GDP: Weak. The Bureau of Economic Analysis released its first estimate of Q4 2015 Gross Domestic Product on Friday, which showed the U.S. economy expanded at a seasonally adjusted annualized rate (SAAR) of only 0.7%. This was down from the 2.0% increase during Q3 and the 2.1% bump during the final 3 months of 2014. 4 major components of GDP dragged down economic expansion during Q4: a drop in exports (costing 31-basis points in GDP growth), a slower increase in private
inventories (costing 45-basis points in GPD growth), a drop in fixed  nonresidential investment (costing 24-basis points in GDP growth) and a gain in imports (costing 16-basis points in GDP growth). A slower increase in consumer spending (+2.2% vs. +3.0% in Q3) led to a smaller positive contribution to GDP (+146-basis points). Making more modest positive contributions to economic growth in Q4 were fixed residential investment (+27-basis points) and government expenditures (+12-basis points). For all of 2015, GDP grew 2.4%, matching the growth rate in 2014 and above the 1.5% gain during 2013. The BEA will revise its estimate of Q4 GDP twice over the next 2 months.
 Sales of new homes zoomed up in December. The Census Bureau measure of new home sales jumped 10.8% during the month to a seasonally adjusted annualized rate (SAAR) of 544,000 units (+9.9.% vs. December 2014). Sales were up in all 4 Census regions, including percentage gains exceeding 20% in 3 of 4 Census regions (sales were “only” up 0.4% in the South). Versus a year earlier, sales were up 21.9% and 38.9% in the West and Midwest, respectively, unchanged in the South and down 6.5% in the Northeast. The count of unsold homes crept up 2.6% during the month to 237,000 units, the equivalent to a 5.2 month supply. One interesting tidbit is that mix of homes sold in December appears to have included a greater percentage of less expensive homes: the median sales price was $288,900, down 4.3% from December 2014.
 Another month, another feeble durable goods report. The Census Bureau estimates new orders for manufactured durable goods plummeted 5.1% during December to a seasonally adjusted $225.4 billion (-0.6% vs. December 2015). This was the 4th decline over the past 5 months. Transportation orders were in a freefall with a 12.4% decline, which included a 29.4% drop in civilian aircraft orders, a 69.1% decrease in military aircraft and a 0.4% slowdown in car/truck orders. Net of transportation goods, new orders fell 1.2% during the month and were 3.2% under year ago levels. New orders fell in December for fabricated metal products, machinery and computers/electronics and nondefense/non-aircraft capital goods (a proxy for business investment). Shipments declined for the 2nd time over the past 3 months with a 2.2% drop (although they were unchanged net of transportation goods). The value of unfilled orders for durable goods shrank 0.5% during December while inventories expanded 0.5%.
 2 consumer confidence surveys show modest changes in sentiment during January. The Conference Board’s Consumer Confidence Index gained 1.8 points during December to 98.1 (1985=100), its best reading since October. While the present conditions index was unchanged during the month at 116.4, the expectations index added 2.9 points to 85.9. 22.8% of survey respondents described that the number of available jobs was “plentiful” versus 23.4% that find them to be “hard to get.” Further, 18.1% of consumers expect income will increase over the near terms versus 10.8% anticipating a decline. The press release noted that consumers “do not foresee the volatility in financial markets as having a negative impact on the economy.”
Another survey slightly disagrees. The Index of Consumer Sentiment from the University of Michigan slipped 6/10ths of a point to 92.0 (1966 Q1=100). This was down 1.3 points from the preliminary January reading released several weeks ago with the decline attributed to the recent volatility in the stock market. The expectations index held steady from December (with a reading of 82.7) while the present conditions index shed 1.7 points to 106.4. Per the press release, consumers are expecting a slowdown in economic growth “accompanied by smaller wage gains and slight increases…in unemployment by the end 2016.” The researchers say the data suggest real consumer spending will increase 2.7% in 2016.
Other data released over the past week that you might find of interest:
– Jobless Claims (week ending January 16, 2016, seasonally adjusted): 278,000 (-16,000 vs. previous week; +11,000 vs. same week a year earlier). 4-week moving average: 283,000 (-3.0% vs. same week a year earlier).
– Pending Home Sales (December 2015, Index (2001=100), seasonally adjusted): 106.8 (+1/10th of a point vs. November 2015, +4.3 points vs. December 2014).
– State Employment (December 2015, Change in Nonfarm Payrolls, seasonally adjusted): vs. November 2015: grew in 36 states and the District of Columbia, decreased in 14 states. vs. December 2014: 43 states and the District of Columbia, fell in 7 states.
The opinions expressed here are not necessarily those of Kevin’s current and previous employers. No endorsements are implied.
