
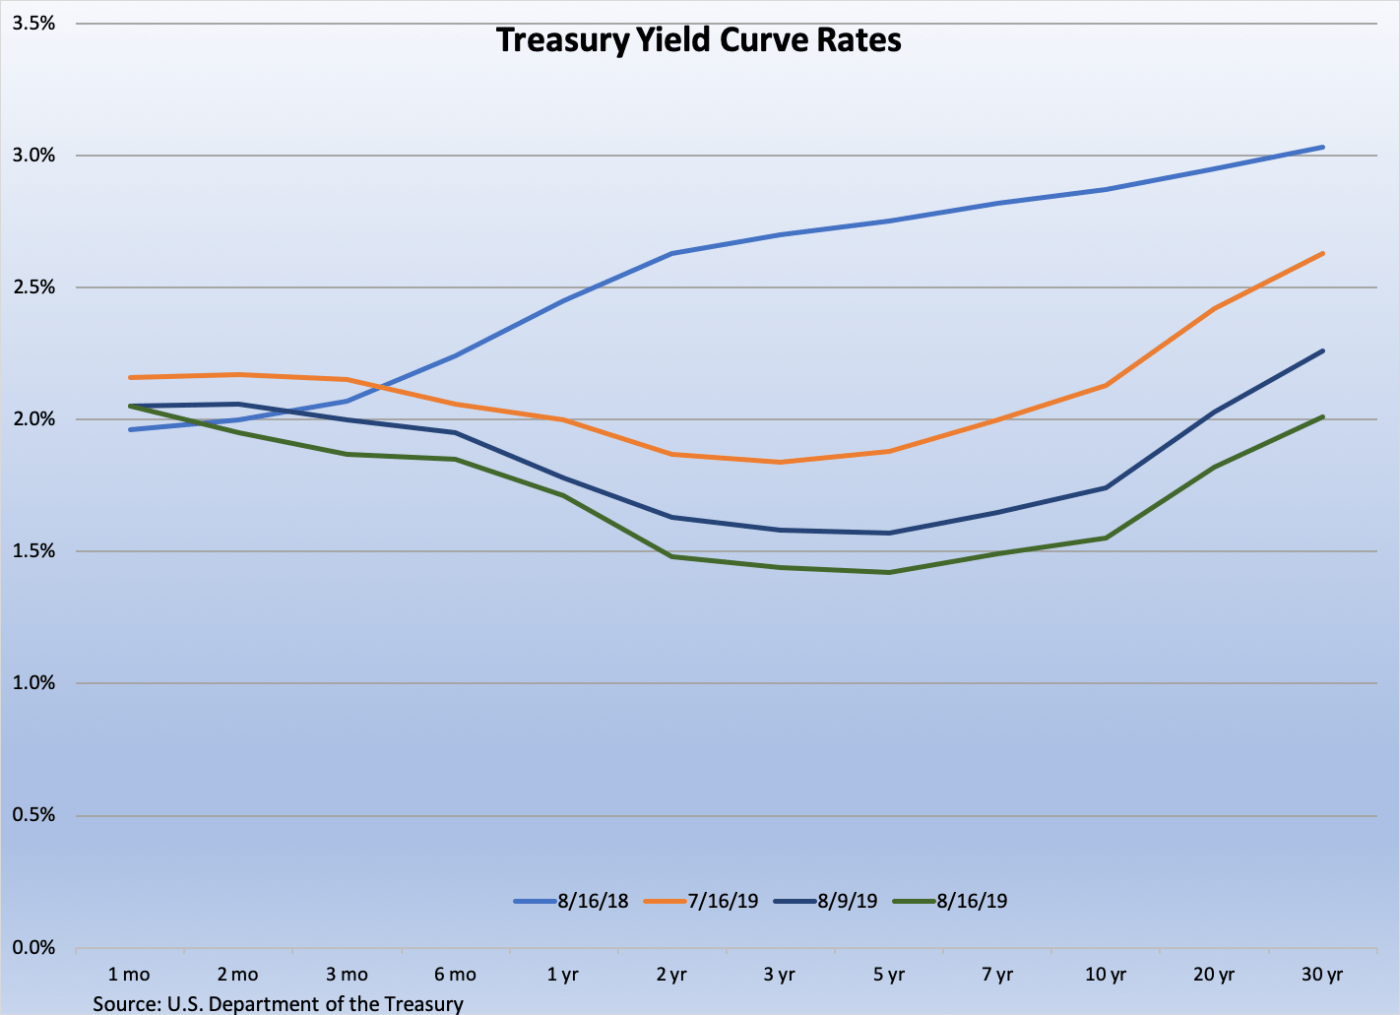
In a week where the yield curve momentarily inverted, economic data pointed in different directions. Here are the five things we learned from U.S. economic data released during the week ending August 16.
 On the good news side, retail sales flourished in July. The Census Bureau estimates U.S. retail and food services sales increased 0.7 percent during the month to a seasonally adjusted $523.5 billion, up 3.4 percent from a year earlier. Sales at car dealers/parts stores slumped 0.6 percent but rose 1.8 percent at gas stations (thanks to higher prices at the pump). Net of both, core retail sales jumped 0.9 percent in July and 4.2 percent over the past year. Rising were sales at department stores (+1.2 percent) and restaurants/bars (+1.1 percent) and at retailers focused on electronics/appliances (+0.9 percent), apparel (+0.8 percent), groceries (+0.7 percent), furniture (+0.3 percent), and building materials (+0.2 percent).
 But manufacturing production fell in July. The Federal Reserve estimates manufacturing output dropped 0.4 percent on a seasonally adjusted basis, its first decline in three months. Durable goods production slowed 0.2 percent, with output declines of greater than one percent for wood products, nonmetallic products, and machinery. Nondurable goods production plummeted 0.5 percent, hurt by greater than one percent drops for plastic/rubber, textiles, and printing. Manufacturing has slumped 0.5 percent over the past year. Overall industrial production slipped 0.2 percent during July but remained a half percentage ahead of the year-ago pace. During the month, mining output slowed 1.8 percent (oil and gas well drilling: -3.3 percent) while production at utilities surged 3.1 percent (think hot summer weather).
 Consumer inflation bloomed in July. The Bureau of Labor Statistics reports that the consumer price index (CPI) grew 0.3 percent on a seasonally adjusted basis during the month, its fastest increase since April. Prices for energy jumped 1.3 percent, pulled up by a 2.5 percent surge in gasoline prices. Food CPI, however, held steady in July. Net of both energy and food, core CPI grew 0.3 percent for a second consecutive month. Rising were prices for used cars/trucks (+0.9 percent), medical care services (+0.5 percent), apparel (+0.4 percent), shelter (+0.3 percent), transportation services (+0.3 percent), and medical care commodities (+0.2 percent). Over the past year, CPI has risen 1.8 percent while core CPI had a 12-month comparable of +2.2 percent.
 Housing starts slowed in July, or at least they did for condos. The Census Bureau indicates starts of privately-owned homes slid 4.0 percent during the month to a seasonally adjusted annualized rate of 1.241 million units. Despite the decline, housing starts were 0.6 percent ahead of their year-ago pace. July’s drop in starts was on the multi-unit side, which saw a 17.2 percent slump compared to a 1.3 percent increase for single-family home starts. Looking towards the future, the annualized count of issued building permits rose 8.4 percent in July to 1.336 million (+1.5 percent versus July 2018), with monthly gains for both single-family homes (+1.8 percent) and multi-family units (+24.8 percent). The annualized count of completed homes jumped 7.2 percent to 1.250 million, up 6.3 percent from the same month a year earlier.
 And despite it all, small business owners remained confident in July. The Small Business Optimism Index from the National Federation of Independent Business added 1.4 points during the month to a seasonally adjusted reading of 104.7 (1986=100). This followed a 1.7 point drop during June. Seven of the index’s ten components improved during the month, led by higher readings for expected real sales, expectations for the economy to improve, plans to increase employment, and earnings trends. Only two components—current inventories and expected credit conditions—declined in July. The press release noted the dichotomy of “many are talking about a slowing economy” and the general optimism among its survey respondents and stated that “the small business sector remains exceptional.”
Other U.S. economic data released over the past week:
– Jobless Claims (week ending August 10, 2019, First-Time Claims, seasonally adjusted): 220,000 (+9,000 vs. previous week; +5,000 vs. the same week a year earlier). 4-week moving average: 213,750 (-1.4% vs. the same week a year earlier).
– Import Prices (July 2019, All Imports): +0.2% vs. June 2019, -1.8% vs. July 2018. Nonfuel Imports: -0.1% vs. June 2019, -1.3% vs. July 2018.
– Export Prices (July 2019, All Exports): +0.2% vs. June 2019, -0.9% vs. July 2018. Nonagricultural Exports: +0.2% vs. June 2019, -1.5% vs. July 2018.
– Housing Market Index (August 2019, Index (>50 = More Homebuilders See the Housing Market as “Good” versus “Poor,” seasonally adjusted): 66 (vs. July 2019: 65, vs. August 2018: 68.
– Monthly Treasury Statement (July 2019, Federal Budget Surplus/Deficit Over First 10 Months of FY2019): -$866.8 billion (+26.9% vs. First 10 Months of FY2018)
– Productivity (2019 Q2, Nonfarm Business Labor Productivity, seasonally adjusted): 2.3% vs. 2019 Q1, +1.8% vs. 2018 Q2).
– University of Michigan Surveys of Consumers (August 2019-preliminary, Index of Consumer Sentiment (1966Q1=100), seasonally adjusted): 92.1 (vs. July 2019: 98.4, vs. August 2018: 96.2).
– State Employment (July 2019, Nonfarm Payrolls, seasonally adjusted): Vs. June 2019: Increased in 5 states and essentially unchanged in 45 states and the District of Columbia. Vs. July 2018: Increased in 25 states and essentially unchanged in 25 states and the District of Columbia.
– Treasury International Capital Flows (June 2019, Net Foreign Purchases of Domestic Securities, not seasonally adjusted): +$63.8 billion (vs. May 2019: -$4.6 billion, vs. June 2018: -$45.6 billion).
– Business Inventories (June 2019, Manufacturers’ and Trade Inventories, seasonally adjusted): $2.036 trillion (Unchanged vs. May 2019, +5.2% vs. June 2018).
The opinions expressed here are not necessarily those of Kevin’s current employer. No endorsements are implied.
