
Q4 GDP was revised upward, but consumer spending has been sluggish during the first two months of 2018. Here are the five things we learned from U.S. economic data released during the week ending March 30.
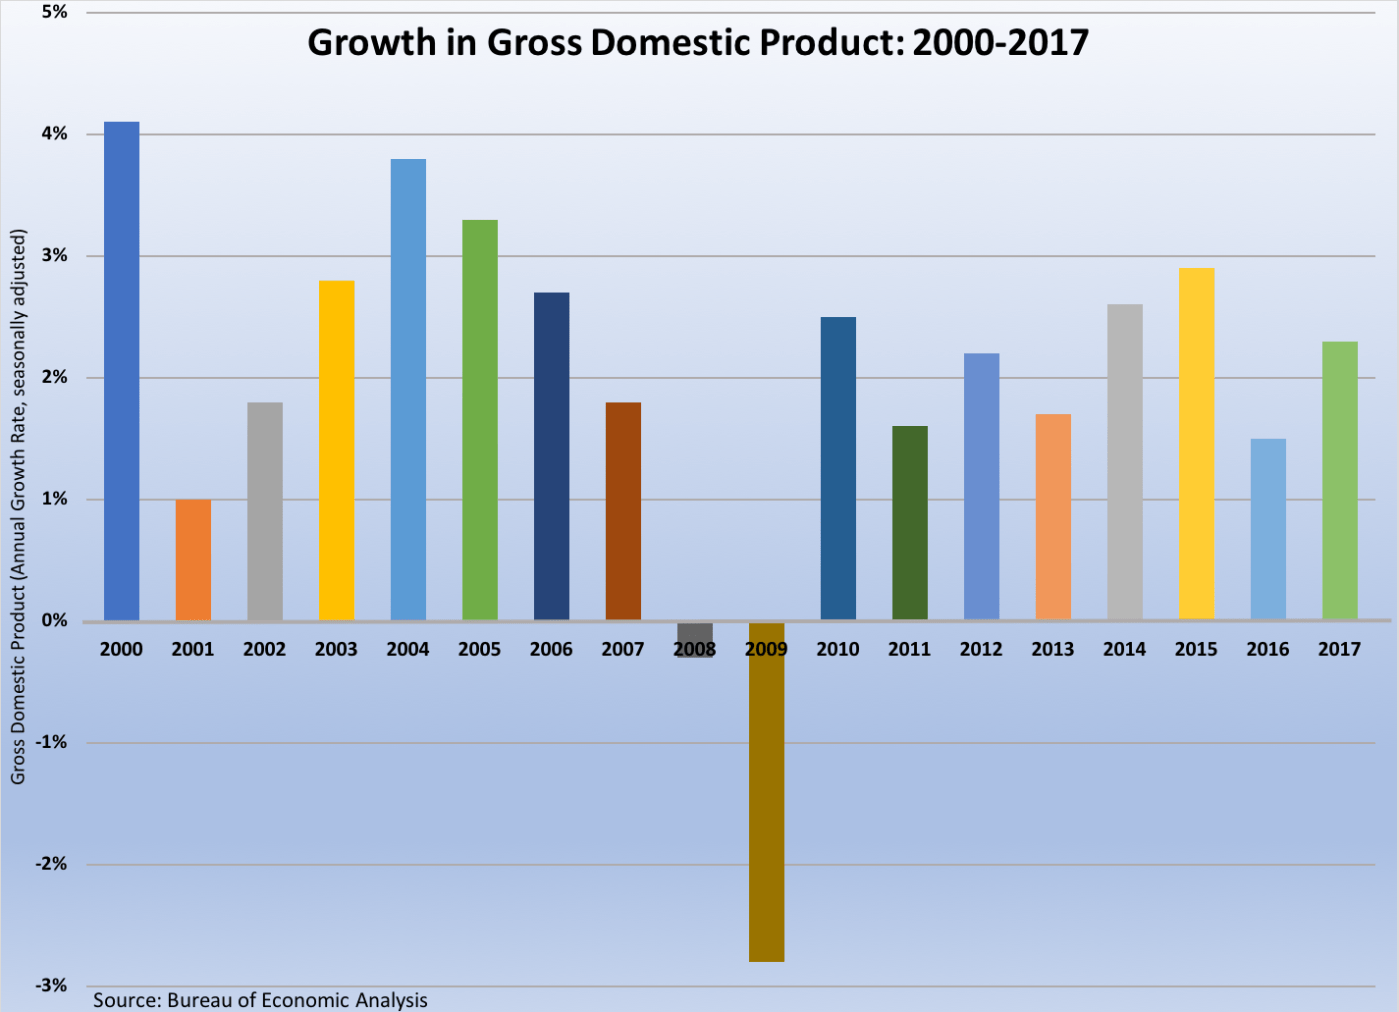
 A new estimate finds that the U.S. economy expanded during Q4 more quickly than previously reported. The Bureau of Economic Analysis’ third estimate of Gross Domestic Product (GDP) finds the U.S. economic swelled 2.9 percent on a seasonally adjusted annualized rate (SAAR) during the final three months of 2017. This was up from the 2.5 percent annualized growth rate reported a month earlier. With the upward revision, BEA now estimates the U.S. economy expanded 2.3 percent for all of 2017, which was an improvement from the 1.5 percent growth rate in 2016 but below 2015’s 2.9 percent gain. The latest revision to Q4 GDP was the result of higher than previously believed levels of personal spending and private inventory investment. Positive contributors to GDP growth during the quarter were personal spending, fixed investment, and government spending, while net exports and private inventory accumulation were both drags on economic growth. Corporate profits slipped 0.1 percent during Q4 following a 4.3 percent bump during Q3.
 The U.S. economy gained momentum in February. The Chicago Fed National Activity Index (CFNAI), a weighted average of 85 economic indicators, surged by 86-basis points during the month to a seasonally adjusted reading of +0.88. This was the CFNAI’s best reading since last October. Much of the gain came from production-related economic indicators, which made a +0.50 contribution to the CFNAI (a big improvement from January when the same measures had made a negative -0.15 contribution). Also making positive contributions during the month were indicators tied to employment (+0.31) and sales/orders/inventories (+0.09). Dragging down the CFNAI were indicators related to consumption/housing (-0.02). In all, 63 of the 85 economic indicators made positive contributions to the CFNAI. The CFNAI’s 3-month moving average gained by 21-basis points to +0.37. Since the CFNAI is indexed such that a reading of 0.00 means the U.S. economy is growing at its historical level, the +0.37 moving average indicates the U.S. economy is expanding at an above average rate.
 Personal spending failed to grow for a second consecutive month. The Bureau of Economic Analysis finds real personal consumption expenditures (PCE) were unchanged during February after having contracted 0.2 percent during January. Even with the recent lack of increases, real PCE has increased 2.8 percent over the past year, matching January’s 12-month comparable. Real spending on services and goods also was steady during February, with the latter split between a 0.6 percent increase in spending on durable goods and a 0.3 percent contraction for nondurables. Over the past year, spending on goods has grown 4.3 percent while that on services was 2.1 percent ahead of year-ago levels. Real disposable personal income gained 0.2 percent during February, slower than January’s 0.6 percent advance. Over the past year, real disposable income has increased 2.1 percent. The gap between spending and income has been covered by a slowdown in savings, although this has recovered in recent months. The personal savings rate was at +3.4 percent in February, up 2/10ths of a percentage point from January. Finally, the Federal Reserve’s preferred gauge of inflation continues to gradually creep up. The PCE deflator has grown 1.8 percent over the past year while the core measure (which removes the impact of energy and food) gained 1.6 percent over the same 12 months.
 Two measures of consumer sentiment moved in opposite directions during March, although both indicate that Americans remain optimistic. The Conference Board’s Consumer Confidence Index shed 2.3 points during the month to a seasonally adjusted reading of 127.7 (1985=100). Despite losing a step during the month, the measure remained 2.8 points ahead of its year-ago reading and stayed close to the 18-year high achieved in February. The present conditions index lost 1.3 points during March to a reading of 159.9 while the expectations index shed three full points to 106.2. 37.9 percent of survey respondents described current business conditions as “good” versus 13.4 percent seeing them as “bad.” Similarly, 39.9 percent of consumer saw the number of available jobs as “plentiful” while only 14.9 percent viewed them as “hard to get.” The press release noted that the results suggest “suggest further strong [economic] growth in the months ahead.”
The University of Michigan’s Index of Consumer Sentiment added 1.7 points during March to a seasonally adjusted 101.5 (1966Q1=100). While this was a small pullback from the preliminary March reading reported a few weeks earlier, this final reading represented a 14-year high point for the sentiment measure and a 4.5 point improvement over the previous year. The current conditions index jumped 6.3 points to a record-high of 121.2 (March 2017: 113.2) while the expectations index slipped 1.2 points to 88.8 (March 2017: 86.5). The press release indicates that the index readings suggest a real growth rate in real personal spending of 2.6 percent from mid-2018 to mid-2019.
 Pending home sales picked up in February. The National Association of Realtors says that its measure of contract signings to purchase a previously owned home gained 3.1 percent during the month to a seasonally adjusted index reading of 107.5 (2001=100). Even with the gain, this was 4.1 percent under the year-ago contract signing pace. The index improved during February in all four Census regions, led by a 10.3 percent bounce in the Northeast. The Pending Home Sales Index also grew 3.0 percent in the South, 0.7 percent in the Midwest and 0.4 percent in the West. All four regions had negative 12-month comparables, spanning from a 9.5 percent drop in the Midwest to a 1.5 percent year-to-year slowdown in the South. The press release notes that the “minuscule” number of homes on the market and “its adverse effect on affordability” as weighing on the housing market.
Other U.S. economic data released over the past week:
– Jobless Claims (week ending March 24, 2018, First-Time Claims, seasonally adjusted): 215,000 (-12,000 vs. previous week; -38,000 vs. the same week a year earlier). 4-week moving average: 224,500 (-11.1% vs. the same week a year earlier).
– Case-Shiller House Price Index (January 2018, 20-City Index, seasonally adjusted): +0.8% vs. December 2017, +6.4% vs. January 2017.
– Agricultural Prices (February 2018, Prices Received by Farmers (Index (2011=100)): 90.8 (+5.7% vs. January 2018, -0.2% vs. February 2017).
The opinions expressed here are not necessarily those of Kevin’s current employer. No endorsements are implied.
