
The U.S. economy slammed on its brakes during the first quarter as consumer spending faltered. Here are the 5 things we learned from U.S. economic data released during the week ending April 28.
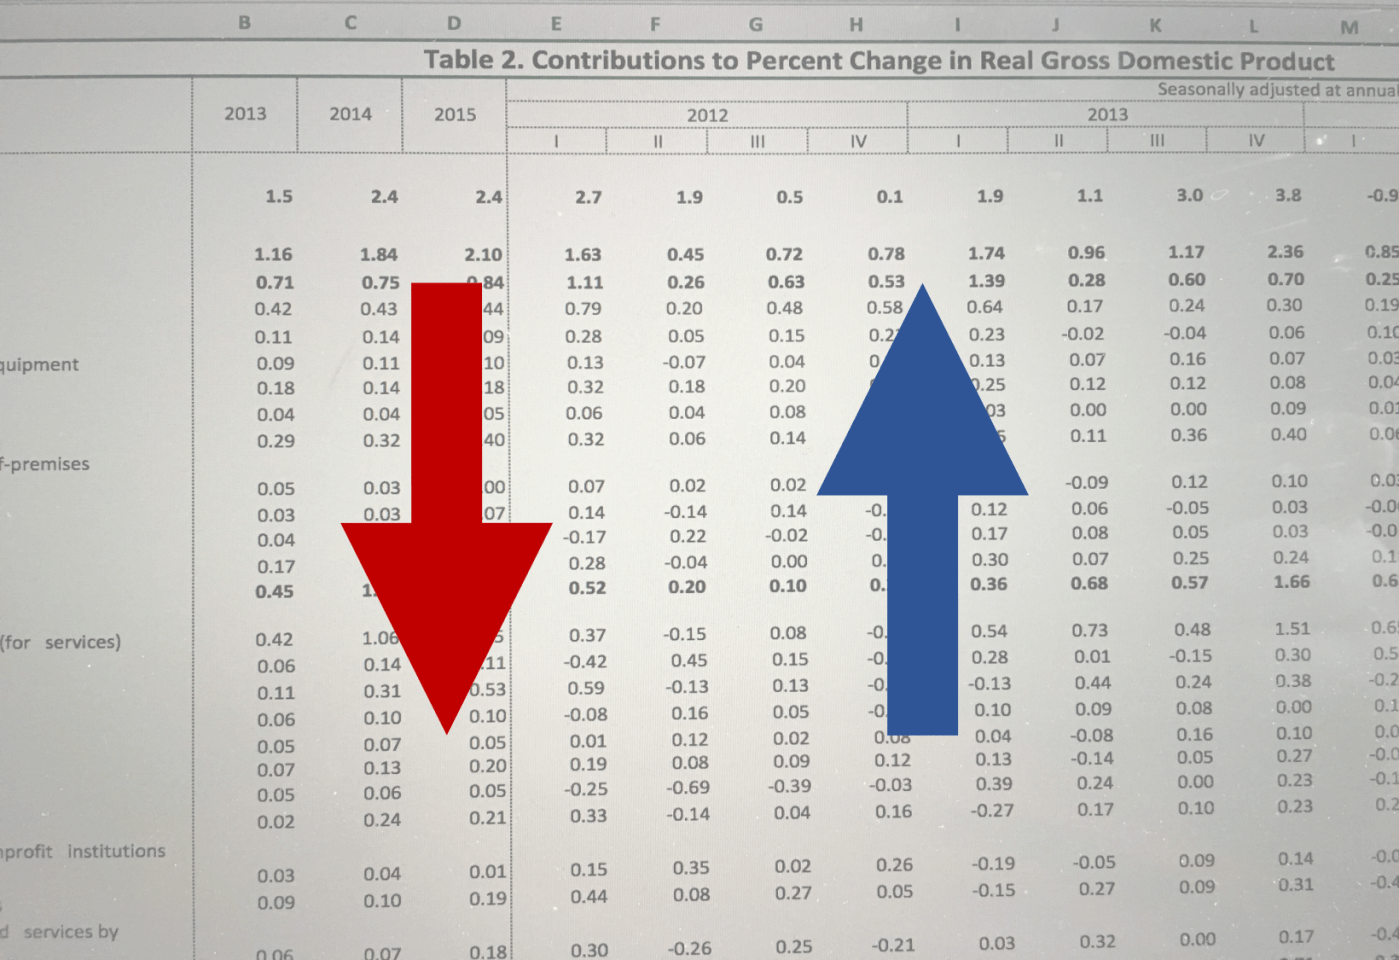
 Economic growth sputtered during the opening months of 2017. Per the Bureau of Economic Analysis, the Gross Domestic Product (GDP) grew by a paltry seasonally adjusted annualized rate (SAAR) of 0.7 percent during the first quarter of 2017. This was the slowest pace of economic expansion since the first quarter of 2014 when the U.S. economy had contracted 1.2 percent (although it is worth noting that GDP grew by only 0.8 percent during the same quarter a year ago). The feeble growth rate in the economy was largely the product of weakness in consumer spending, which increased only 0.7 percent) during the quarter. As a result, personal consumption expenditures contributed a mere 23-basis points in GDP growth during the quarter, versus a 240-basis point contribution during the previous quarter. Also making positive contributions to GDP growth during the quarter were nonresidential fixed investment (+112-basis point contribution), increased exports (+68-basis point contribution), and residential fixed investment (i.e., housing with a +50-basis point contribution). Drags on the U.S. economy were the decline in private inventories (costing 93-basis points in GDP growth), a rise in imports (costing 61-basis points in GDP growth), and a decrease in government spending (costing 30-basis points in GDP growth). The BEA will revise its estimate of Q1 GDP growth twice in the coming two months.
 Still, there is a measure that suggests economic growth was just above its historical average in March. The Chicago Fed National Activity Index (CFNAI), a weighted index of 85 economic indicators that tracks business activity, shed 19-basis points but remained positive at +0.08. More critically, the three-month moving average for the CFNAI came in at +0.03, which was down 13-basis points from February but also was the fourth straight month in which it was positive. A positive reading in the moving average suggests that the U.S. economy is expanding at a rate greater than its historic average. Forty-eight of the 85 components that make up the CFNAI made positive contributions to the index, with three of four major groupings of these indicators making positive contributions: sales/orders/inventories (adding seven-basis points to the index), production (adding four-basis points to the index), and employment (adding two-basis points to the index). Personal consumption/housing-related index components cost five-basis points in CFNAI growth.
 Transportation goods sparked growth in durable goods orders during March. New orders for manufactured durable goods gained 0.7 percent during the month to a seasonally adjusted $238.7 billion, its third consecutive monthly increase. The Census Bureau report indicates new orders for transportation goods rose 2.4 percent, with solid increases in orders for defense aircraft (+26.1 percent) and civilian aircraft (+7.0 percent). New orders for motor vehicles declined for a second straight month with a 0.8 percent contraction. Net of transportation goods, new orders for durable goods slipped 0.2 percent although orders for core capital goods orders inched up 0.2 percent. Growing during the month were new orders for primary metals (+0.8 percent) and electrical equipment (+0.4 percent) while orders fell for computers (-3.8 percent), communications equipment (-1.2 percent), fabricated metal products (-0.8 percent), and machinery (-0.2 percent).
 New home sales hit an eight-year high in March. The Census Bureau reports that new home sales jumped 5.8 percent during the month to a seasonally adjusted annualized rate (SAAR) of 621,000. This was 15.6 percent above year-ago levels and its highest reading since last July (which itself was the post-recession high). Sales grew in three of four Census regions during the month—Northeast (+25.8 percent), West (+16.7 percent), and South (+1.6 percent)—but declined 4.5 percent in the Midwest. All four Census regions enjoyed positive year-to-year sales gains. There were 268,000 new homes available for sale at the end of March, up 1.1 percent from February and 9.8 percent from a year earlier. This translated into a still tight 5.2-month supply of new homes on the market.
 Consumer sentiment remained near post-recession highs in April, although one measure pulled back during the month. The Conference Board’s Consumer Confidence Index fell by 4.6 points during April to a reading of 120.3 (1985=100). March’s reading was the best reading in the sentiment measure since December 2000. The current conditions lost 3.3 points (to 140.6) while the expectations index shed 5.6 points (to 112.3). 30.2 percent of survey respondents felt that current business conditions were “good” (versus 32.4 percent in March), while 13.8 percent saw them as “bad” (versus 13.1 percent in March). Looking towards the future, 24.8 percent of consumers believe business conditions will improve over the next six months while 10.9 percent expect them to worsen. Related, 23.0 percent of survey respondents expect there will be increased job availability in the coming months versus 13.1 percent anticipating a decline. The press release noted that despite a pullback in April, consumer confidence “still remains at strong levels” and that “consumers remain confident that the economy will continue to expand in the months ahead.”
Meanwhile, the University of Michigan’s Index of Consumer Sentiment edged up by 1/10th of a point to a seasonally adjusted reading of 97.0. Despite essentially holding steady during the month, this puts the index eight full points above its April 2016 reading and keeps it near its post-recession high. The current conditions index dropped by a half-point to 112.7 (April 2016: 106.7) while the forward-looking expectations index jumped 9.4 points to 87.0. The press release noted that the “partisan divide” that this survey has been demonstrating in recent months narrowed during April, people who identified themselves as Democrats were far more pessimistic than those who are Republicans. The release also stated that the data points towards an anticipated 2.5 percent growth rate in real consumer spending during 2017.
Other U.S. economic data released over the past week:
– Jobless Claims (week ending April 22, 2017, First-Time Claims, seasonally adjusted): 257,000 (+14,000 vs. previous week; -4,000 vs. the same week a year earlier). 4-week moving average: 242,250 (-7.4% vs. the same week a year earlier).
– Pending Home Sales (March 2017, Index (2001=100), seasonally adjusted): 99.1 (-2.9% vs. February 2017, +1.8% vs. March 2016).
– Case-Shiller Home Price Index (February 2017, 20-City Index, seasonally adjusted): +0.7% vs. January 2017, +5.9% vs. February 2016.
– FHFA House Price Index (February 2017, Purchase-Only Index, seasonally adjusted): +0.8% vs. January 2017, +6.4% vs. February 2016.
– Agricultural Prices (March 2017, Prices Received by Farmers (Index: 2011=100), seasonally adjusted): 94.8 (+3.4% vs. February 2017, +2.4% vs. March 2016).
The opinions expressed here are not necessarily those of Kevin’s current and previous employers. No endorsements are implied.
