

A decline in exports (particularly for soybeans) pulled down economic growth during the final 3 months of 2016. Here are the 5 things we learned from U.S. economic data released during the week ending January 27.
 GDP grew at only a modest pace during the final 3 months of 2016. The Bureau of Economic Analysis‘ first estimate of Q4 2016 Gross Domestic Product (GDP) has the U.S. economy expanding at a 1.9% seasonally adjusted annualized rate during the quarter. This was well below Q3’s +3.5% rate of economic expansion. Most components of the economy made positive contributions to Q4 GDP growth: consumption (adding 170-basis points to GDP growth), growth in private inventories (adding a full percentage point to GDP growth), fixed residential investment (+37-basis point contribution), fixed nonresidential investment (+30-basis point contribution), and state & local government (+28-basis point contribution). But it was net exports (as a drop in exports—particularly for soybeans—and a hike in imports cost 170-basis points in GDP growth) and the federal government (costing another 8-basis points) that slowed the GDP growth rate during the quarter. For all of 2016, the U.S. economy grew 1.6%, down from the 2.6% rate growth rate in GDP of 2015 and the worst year for economic expansion since 2011. The BEA will revise its Q4 GDP estimate twice over the next 2 months.
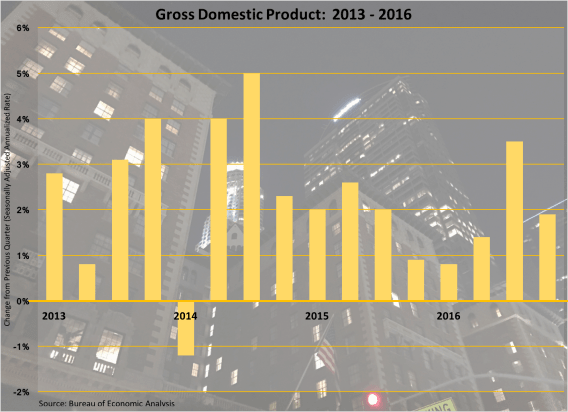
 Affordability and supply weighed on home sales during December. Per the National Association of Realtors, sales of previously owned homes slipped 2.8% during the month to a seasonally adjusted annualized rate (SAAR) of 5.49 million units. This was 0.9% above its year ago sales pace. Existing home sales fell in 3 of 4 Census regions during the month: Northeast (-6.2%), West (-4.8%), and Midwest (-3.8%), but held steady in the South. 3 of 4 Census regions enjoyed positive 12-month comparables: Northeast (+2.7%), Midwest (+2.4%), and South (+0.4%). Sales were 1.6% below their December 2015 pace in the West. Inventories of unsold homes tightened even further, shrinking 10.8% during the month to 1.65 million units (6.3% vs. December 2015). This was the smallest number of homes on the market since NAR started tabulating inventories of all home types back in 1999 and was the equivalent to a paltry 3.6 month supply. The median sales price has increased 4.0% over the past year to $232,200. In its press release, NAR blamed “higher mortgage rates and home prices combined with record low inventory levels” for December’s sales decline.
Meanwhile, new home sales dropped 10.4% during the month to a seasonally adjusted annualized rate of 536,000 -0.4% vs. December 2015), according to the Census Bureau. Sales dropped in 3 of 4 Census regions during the month with the Northeast being the only region with a sales gain. Only 2 regions—the Northeast and West—had positive 12-month sales comparables. The inventory of unsold homes grew by 4.0% during December to 259,000 homes (+10.2%). This translated into a 5.8 month supply of new homes on the market. The median sales price of $322,500 was 7.9% above its year ago mark.
 Durable goods orders slowed in December. The Census Bureau estimates that new orders for durable goods declined 1.0% during the month to a seasonally adjusted $227.0 billion. Orders for transportation goods fell 2.2% during the month, pulled down a 63.9% drop in defense aircraft orders. Orders increased for civilian aircraft (+42.4%) and automobiles (+2.0%). Net of transportation goods, durable goods orders grew 0.5% during the month with increased orders for computers/electronics (+2.4%), electrical equipment/appliances (+0.6%), and machinery (+0.4%). New orders fell for primary metals (-0.9%) and fabricated metal products (-0.8%). Shipments of durable goods increased for the 3rd time in 4 months with a 1.4% bump up to $238.0 billion. Net of transportation goods, shipments increased 0.8%. The value of unfilled orders declined for the 6th time in 7 months (-0.6% to $1.119 trillion) while inventories were virtually unchanged at $384.4 billion.
 Leading economic indicators point to accelerating business activity in December. The Consumer Board’s Leading Economic Index jumped by 6/10ths of a point to 124.6 (2010 = 100). While 6 of the leading index’s 10 components added to the index, the biggest positive contributors were the interest rate spread, stock prices, and consumer expectations for business conditions. The coincident index added 3/10ths of a point to 114.3, with all 4 index components making positive contributions, including industrial production and nonfarm payrolls. The lagging index grew by 4/10ths of a point to 123.4 with 4 of 7 components making positive contributions, including commercial & industrial loans outstanding, the average prime rate charged by banks, and the average length of unemployment. The press release said the U.S. economy “will continue growing at a moderate pace, perhaps even accelerating slightly in the early months of this year.”
 Consumer confidence held firm in January. The University of Michigan Index of Consumer Sentiment added 3/10ths of a point to a seasonally adjusted reading of 98.5 (1966Q1 = 100). This was the measure’s best reading in 13 years as sentiment continued to improve following last November’s election. A year earlier, the Index of Consumer Sentiment was at 92.0. The current conditions index shed 6/10ths of a point during the month to a reading of 111.3 (January 2016: 106.4) while the expectations index added 7/10ths of a point to 90.3 (January 2016: 82.7). The press release indicated that the “highest proportion” of survey respondents in a decade “anticipated improved finances,” with the largest percentage of survey respondents since 2008 expecting income gains. The press release also noted that sentiment varied by one’s partisan views, with “Democrats becoming much more pessimistic and Republicans much more optimistic.”
Other U.S. economic data released over the past week:
– Jobless Claims (week ending January 21, 2017, First-Time Claims, seasonally adjusted): 259,000 (+22,000 vs. previous week; -16,000 vs. the same week a year earlier). 4-week moving average: 245,500 (-12.6% vs. the same week a year earlier).
– Chicago Fed National Activity Index (December 2016, Index (0.00 = historic growth rate, seasonally adjusted): +0.14 (vs. -0.33 in November 2016, vs. -0.21 in December 2015). 3-month moving average: -0.07 (vs. -0.14 in November 2016, -0.26 in December 2015).
– Regional and State Employment (December 2016, Change in Nonfarm Employment, seasonally adjusted): Vs. November 2016: Up in 3 states, down in 5 states and essentially unchanged in 42 states and the District of Columbia. Vs. December 2015: Up 26 states and the District of Columbia, down in 2 states, and essentially unchanged in 22 states.
– FHFA House Price Index (November 2016, Purchase-Only Index, seasonally adjusted): +0.5% vs. October 2016, +6.1% vs. November 2015.
– Bankruptcy Filings (2016, Count of Filings): 794,960 (-5.9% vs. 2015), Business filings: 24,114 (-2.5% vs. 2015), Non-business filings: 770,846 (-6.0% vs. 2015).
The opinions expressed here are not necessarily those of Kevin’s current and previous employers. No endorsements are implied.
