
The FOMC once again left its interest rate target alone. But the latest labor market report, including firming wage data, suggest a move may come in December. Here are the 5 things we learned from U.S. economic data released during the week ending November 4.
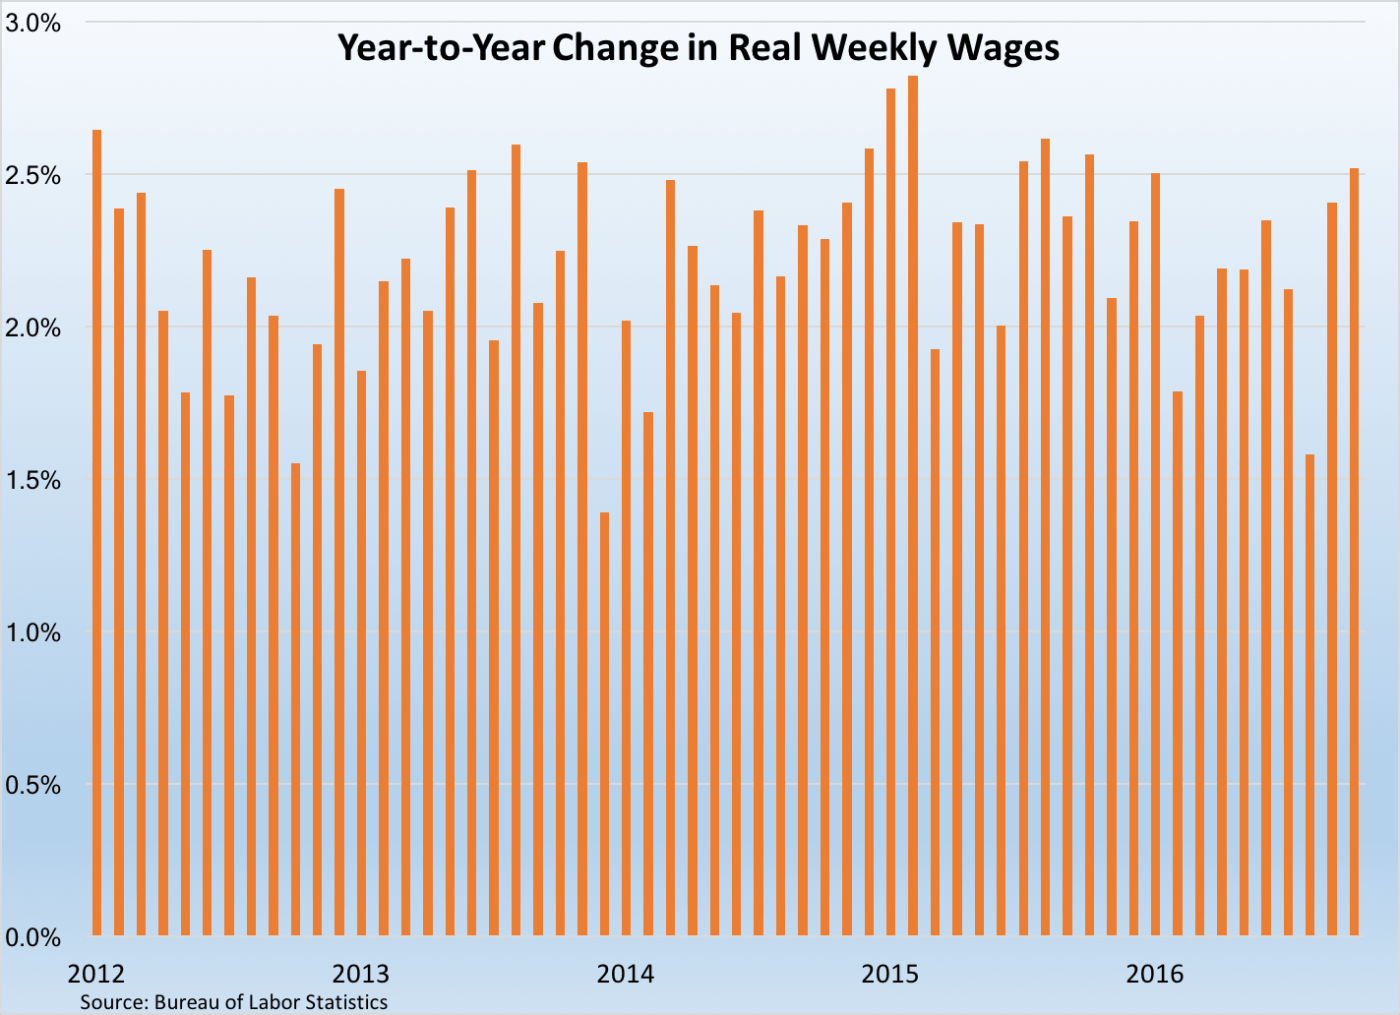
 Employers added 161,000 jobs during October. The Bureau of Labor Statistics finds nonfarm payrolls growing by a seasonally adjusted 161,000 during the month to 144.952 million, an increase of 2.357 million jobs over the past year. Private sector employers added 142,000 jobs to their payrolls, with all of the increase in the service sector. Industries with the largest monthly increase in payrolls were professional/business services (+43,000), health care/social assistance (+39,100), financial activities (+14,000), construction (+11,000), and leisure/hospitality (+10,000). While the average number of hours worked held steady 34.4 hours (October 2015: 34.5), average weekly earnings grew by $3.44 to $891.65. Average weekly earnings have increased 2.5% over the past year, the largest annual growth rate in weekly earnings reported in 2016.
A separate survey of households puts the unemployment rate at 4.9%, down 1/10th of a percentage point from both the previous month and a year earlier. At the same time, 195,000 people exited the labor market during the month, putting the labor force participation rate near a 4-decade low at 62.8. The median length of unemployment slipped by 1/10th of a week to 10.2 weeks (a post-recession low). While the count of people holding a part-time job but seeking a full-time opportunity (i.e., “involuntary” part-time workers) essentially held steady for the month at 5.889 million people, it was 2.2% above the count from a year earlier. Meanwhile, the broadest measure of labor underutilization reported by the BLS dropped to another post-recession low at 9.5%. This was down 2/10ths of a point from September and 3/10ths of a point from the October 2015 reading.
 Consumer spending rebounded in September. The Bureau of Economic Analysis reports that real personal consumption expenditures (PCE) increased 0.3% during the month following a 0.2% decline during the prior month. As a result of September’s increase, consumer spending was 2.4% above the year ago pace. Spending on goods grew 0.5% during the month, split between a 1.8% jump in durable goods spending and a 0.1% decline in spending of nondurables. Spending on services edged up 1/10th of a percentage point during the month. Without controlling for inflation, nominal spending increased 0.5% during the month. The increase in spending was funded partially by a 0.3% gain in nominal personal income. Real disposable income was unchanged during the month. Meanwhile, the savings rate slipped 1/10th of a percentage point to +5.7%.
 FOMC holds still, but things may be different in December. In the policy statement released following the conclusion of its meeting, the Federal Open Market Committee noted that the labor market had “continued to strengthen” and that economic growth had “picked up.” While consumer spending has been “rising moderately,” the same could not be said for the pace of business investment. Further, inflation remained below the Fed’s 2% target rate even with recent increases. As a result, the voting FOMC members decided (with 2 dissenting votes) to keep the fed funds target rate at 0.25-0.50%. But the statement seemingly sets up a possible rate hike in December by noting it had decided “for the time being” to keep rates steady as it waits for “further evidence of continued progress” in economic activity. The October employment report could be one of those pieces of evidence. We will see.
 September had the smallest trade deficit in a year and a half. The Census Bureau and the Bureau of Economic Analysis report that exports grew for a 4th straight month during September with a $1.0 billion increase to $189.2 billion (+0.9% vs. September 2015) while imports slowed by $3.0 billion to $225.6 billion (-1.3% vs September 2015). The resulting trade deficit of -$36.4 billion was the smallest reported since February 2015. The increase in exports occurred despite a $2.0 billion decline in soybean exports (which recently had been growing) as exports grew for civilian aircraft and consumer goods. The decline in imports reflected declines in imported capital goods, consumer goods, and intellectual property (this was because a one-time payment by NBC/Universal in August to broadcast the Olympic). Growing during the month were imports of vehicles.
 Two surveys of purchasing managers indicate a decline in new orders. The Purchasing Managers Index from the Institute for Supply Management added 4/10ths of a point to a seasonally adjusted reading of 51.5. This was the 2nd straight month and the 7th time in the past 8 months in which the PMI was above a reading of 50.0, indicative of an expanding manufacturing sector. Even though the PMI grew during the month, the most notable thing from the report may be the sizable 3.0 point drop in the new orders index (to 52.1). Also falling was the index for inventories (down 2.0 to 47.5), while index components for employment (+3.2 to 52.9) supplier deliveries (+1.9 to 52.2), and production (+1.8 to 54.6) all improved from their September readings. 10 of 18 tracked manufacturing industries reported growth during the month, led by textile mills
Meanwhile, the headline index from the ISM’s Report on Business for nonmanufacturing shed 2.3 points to a reading of 54.8. This was the 81st consecutive month in which the measure of service sector activity was above a reading of 50.0. While all 4 index components declined during September, each remained above a reading of 50.0: employment (-4.1 to 53.1), business activity/production (-2.6 to 57.7), new orders (-2.3 to 57.7), and supplier deliveries (-1/2 point to 50.5). 13 of 18 tracked nonmanufacturing industries expanded during the month, led by transportation/warehousing and construction. The press release notes that most survey respondents expressed “mostly positive” comments about business conditions but also that “[s]everal comments were made about the uncertainty on the impact of the upcoming U.S. presidential election.”
Other data released over the past week that you might find of interest:
– Jobless Claims (week ending October 29, 2016, First-Time Claims, seasonally adjusted): 265,000 (+7,000 vs. previous week; -13,000 vs. the same week a year earlier). 4-week moving average: 257,750 (-3.6% vs. the same week a year earlier).
– Factory Orders (September 2016, New Orders, seasonally adjusted): $455.5 billion (+0.3% vs. August 2016, +0.6% vs. September 2015).
– Construction Spending (September 2016, Value of Construction Put into Place, seasonally adjusted): $1.150 trillion (-0.4% vs. August 2016, -0.2% vs. September 2015).
– Vehicle Sales (October 2016, seasonally adjusted annualized rate): 18.02 million vehicles (+1.5% vs. September 2016, -0.8% vs. October 2015).
– Productivity (3rd Quarter 2016, Nonfarm Business Labor Productivity, seasonally adjusted): +3.1% vs. Q2 2016, Unchanged vs. Q3 2015.
– Agricultural Prices (September 2016, Prices Received by Farmers (Index: 2011=100), seasonally adjusted): 86.5 (August 2016: 90.0, September 2015: 96.3).
The opinions expressed here are not necessarily those of Kevin’s current and previous employers. No endorsements are implied.
