

Q3 was the best quarter for GDP growth in 2 years, but consumer confidence slipped during the final days of the 2016 election. Here are the 5 things we learned from U.S. economic data released during the week ending October 28.
 Q3 featured the fastest pace of economic growth in 2 years, although it was not overly robust. The Bureau of Economic Analysis’ first estimate of Q3 Gross Domestic Product (GDP) finds the U.S. economy grew 2.9% on a seasonally adjusted annualized rate. This followed 3 straight quarter of sub 2% growth and the fastest rate of economic expansion since a 5.0% gain during Q3 2014. Most major components of the economy made positive contributions to GDP growth. This included a 147-basis positive contribution from the 2.1% increase in personal spending, an improved net exports picture (+83-basis points), and increases in both private inventories (61-basis points) and government expenditures (+9-basis points). Fixed investment, and more precisely housing, was a drag on GDP during the quarter. A 6.2% annualized drop in residential fixed investment cost 24-basis points in GDP growth while nonresidential fixed investment added 15-basis points to the quarter’s economic expansion. The BEA will revise its estimate of Q3 GDP twice over the next 2 months.
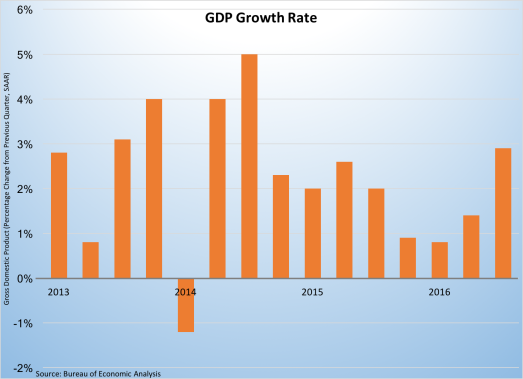
 Economic activity improved during September, but growth remained below its historic growth rate. The Chicago National Activity Index (CFNAI), a weighted index of 85 economic indicators, improved by 58-basis points to a reading of -0.14. The Federal Reserve Bank of Chicago’s index is designed so a reading of 0.00 indicates economic growth at the historic rate. A negative reading between zero and -0.70 suggests below average growth while a reading below -0.70 for more than 3 months suggests an economic contraction. 41 of the 85 economic indicators made a positive contribution to the CFNAI, with all 4 of major categories of indicators (production/income, employment, personal consumption/housing, and sales/orders) improving from their August readings. The CFNAI’s 3-month moving average shed 7-basis points to a reading of -0.21, its lowest reading since last May.
 Durable goods orders slipped in September, pulled down by a sharp decline in sales of defense aircraft. The Census Bureau estimates new orders for manufactured durable goods was at a seasonally adjusted $227.3 billion, down 0.1% from August. Orders for transportation goods fell 0.8% as new orders for defense aircraft plummeted 44.8% (orders for civilian aircraft improved by 12.55% while motor vehicle orders gained 1.2%). Net of transportation goods, new durable goods orders increased 0.2%. Growing were orders for electrical equipment/appliances (+1.5%) and machinery (+1.2%). Falling were new orders for computer/electronic products, fabricated metal products (-0.4%), and primary metals (-0.3%). Shipments of durable goods grew for the 3rd time in 4 months with a 0.8% bump up to $234.5 billion. Shipments of transportation goods jumped 2.3%, while shipments net of transportation goods eked out a 0.1% increase.
 Consumer confidence weakened during October. The Conference Board’s Consumer Confidence Index lost 4.9 points during the month to a seasonally adjusted reading of 98.6 (1985=100), its lowest reading in 3 months. Both the current and expectation conditions indices fell from their September readings. The former dropped 7.3 points to a reading of 120.6 while the latter shed 3.3 points to 83.9. The percentage of survey respondents who felt that jobs were “plentiful” decreased 3.3 percentage points to 24.3% while the percentage saying jobs were “hard to get” slipped 1.2 percentage points to 22.1%. The press release said the survey results suggest that the U.S. economy “will continue to expand in the near-term, but at a moderate pace.”
Also giving back points in October was the Index of Consumer Sentiment from the University of Michigan, which lost 4.0 points to a seasonally adjusted reading of 87.2 (1966Q1=100). This was consumer sentiment measure’s lowest reading in 13 months. The current conditions index lost a full point to 103.2 while the expectations index plummeted 5.9 points to 76.8. While half of the survey respondents anticipate an economic downtown within the next 5 years, the press release attributed some of the sudden anxiety to “uncertainty caused by the election.” The same press release also indicated that the results point to “real” consumer spending growing at an annualized 2.5% rate through the middle of next year.
 The last set of September housing data shows higher sales activity. The Census Bureau reports that new home sales grew 3.1% during September to a seasonally adjusted annualized rate of 593,000 units. This was 29.8% above the year ago rate. Sales grew during the month in 3 of 4 Census regions (Northeast, Midwest, South) with 12-month comparables greater than 25% in all 4 regions. Inventories of unsold homes were at a very tight 4.8 month supply, or 235,000 units. The median sales price of new homes of $313,500 was up 1.9% from a year earlier.
The Pending Homes Sales Index edged up 1.5% during September to an index reading of 110.0 (100=2001). This put the National Association of Realtors’ measure of home purchase contract signing activity 2.4% above its year ago mark. The index gained in 2 of 4 Census regions—West (+4.7%) and South (+1.9%)—but fell in the Northeast (-1.6%) and Midwest (-0.2%). The index had a positive 12-month comparable in 3 of 4 Census regions: Northeast (+7.7%), West (+4.0%), and South (+1.7%). Contract signing activity, however, was off 1.0% in the Midwest versus a year earlier. NAR’s press release noted that buyers’ demand was “holding up impressively” with “much stronger foot traffic.”
Other data released over the past week that you might find of interest:
– Jobless Claims (week ending October 22, 2016, First-Time Claims, seasonally adjusted): 258,000 (-3,000 vs. previous week; -7,000 vs. the same week a year earlier). 4-week moving average: 253,000 (-4.4% vs. the same week a year earlier).
– Case-Shiller Home Price Index (August 2016, 20-City Index, seasonally adjusted): +0.2% vs. July 2016, +5.1% vs. August 2015.
– FHFA House Price Index (August 2016, Purchase-Only Index, seasonally adjusted): +0.7% vs. July 2016, +6.4% vs. August 2015.
– Bankruptcy Filings (12-month Period Ending September 30, 2016): 805,580 (-6.3% vs. 12 month period ending September 30, 2015).
The opinions expressed here are not necessarily those of Kevin’s current and previous employers. No endorsements are implied.
