
GDP growth decelerated a bit as 2017 wrapped up, but economic activity was solid in December. Here are the five things we learned from U.S. economic data released during the week ending January 26.
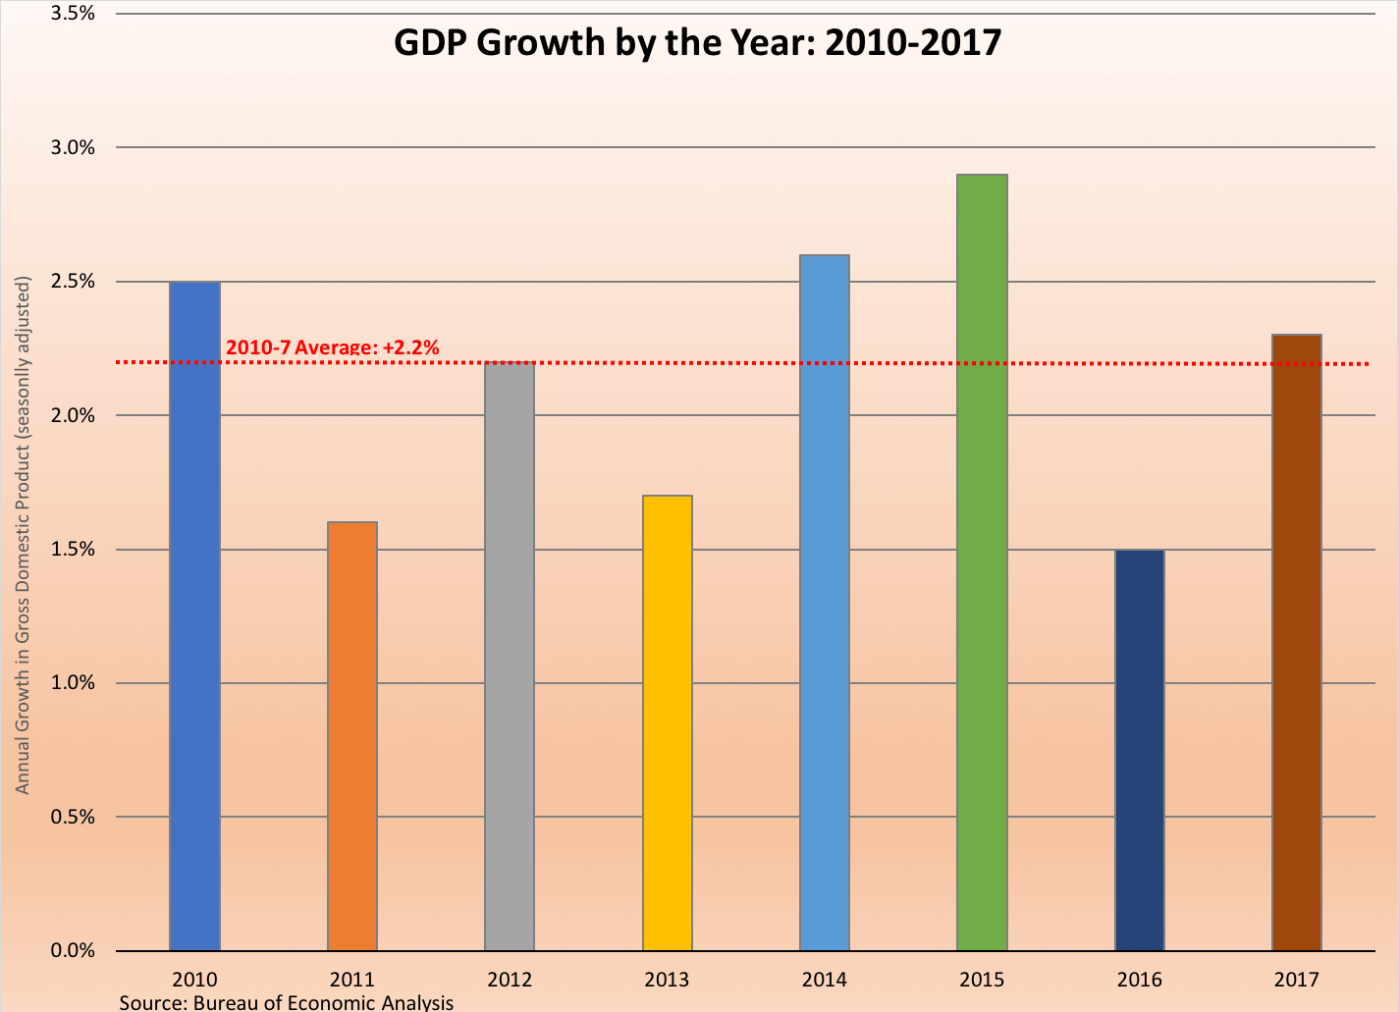
 U.S. economic expansion slowed slightly during the fourth quarter. The Bureau of Economic Analysis reports the Gross Domestic Product (GDP) expanded 2.6 percent on a seasonally adjusted annualized rate (SAAR) during the final three months of 2017. This was down from GDP growth rates of 3.2 percent and 3.1 percent during the third and second quarters of the year, respectively. GDP grew 2.3 percent for all of 2017, an improvement from the 1.5 percent gain in 2016 but below the 2014 and 2015 increases of 2.6 percent and 2.9 percent, respectively. The most significant drag on Q4 GDP growth was the 13.9 percent jump in imports, which had cost 196-basis points in GDP growth alone. A contraction in private sector inventories took away another 67-basis points in GDP growth. Contributing to economic expansion during the quarter were personal consumption (adding 258-basis points to GDP growth), fixed nonresidential investment (adding 84-basis points), exports (82-basis points), government expenditures (adding 50-basis point), and fixed residential investment (adding 42-basis points). The BEA will revise its estimate of Q4 GDP growth twice over the next two months.
 December economic activity measures point to strengthening during the month. The Chicago Fed National Activity Index (CFNAI), a weighted average of 85 economic indicators set to equal 0.00 when the U.S. economy is expanding at its historical average, added 16-basis points during December to a seasonally adjusted 0.27. This was the third month of the past four in which the CFNAI had a positive reading. Forty-three of the 85 index components made positive contributions to the CFNAI. Two of the four major groupings of index components improved from their November readings: production/income (up 27-basis points to +0.25) and sales/orders/inventories (up four basis points to +0.08). Losing ground were CFNAI components tied to employment (down 11-basis points to +0.01) and consumption/housing (off four-basis points to -0.07). The three-month moving average for the CFNAI (which removes some of the month-to-month volatility) slipped by a single basis point to +0.42, the third straight month in which it was positive.
The Conference Board’s Leading Economic Index (LEI) grew by 6/10ths of a basis point to 107.0 (2016=100), with the forward-looking measure of activity having increased 5.7 percent over the past year. Seven of the ten components of the LEI made a positive contribution to the LEI. All four components of the coincident index made a positive contribution, resulting in the measure of contemporaneous economic activity to grow 3/10ths of a point to 102.8 (+2.1 percent versus December 2016). The lagging index was at 104.0, up 7/10ths of a point for the month and 2.7 percent from a year earlier as five of seven index components made positive contributions. The press release points out that the strength in the leading index came from “new orders in manufacturing, consumers’ outlook on the economy, improving stock markets and financial conditions.”
 Tight inventories continued to rein in existing home sales. The National Association of Realtors reports sales of previously owned homes slumped 3.6 percent during December to a seasonally adjusted annualized rate (SAAR) of 5.57 million units. This was 1.1 percent above the December 2016 sales pace. Sales fell in all four Census regions: Northeast (-7.5 percent), Midwest (-6.3 percent), South (-1.7 percent), and West (-1.6 percent). Versus a year earlier, sales have risen in the South and Midwest but were off in the Northeast and West. Inventories contracted further during the month, shrinking 11.4 percent during the month to 1.48 million units. This was the equivalent to an extraordinarily tight 3.2 month supply. As a result, the median sales price of $246,800 was up 5.8 percent from the same month a year earlier. The press release noted that tight inventories and declining housing affordability “ultimately muted what should have been a stronger sales pace.”
 New homes market gave back some of their November sales gains. New home sales sank 9.3 percent during December to a seasonally adjusted annualized rate of 625,000 units, per the Census Bureau. Even with the decline, sales remained 14.1 percent above that of a year earlier. Like with existing home sales above, new home sales slowed during the month in all four Census regions: Midwest (-10.0 percent), South (-9.8 percent), West (-9.5 percent), and Northeast (-2.4 percent). The inventory of unsold new homes inched up by 10,000 units to 295,000 homes, an increase of 15.2 percent from a year earlier and the equivalent to a 5.7 month supply. The median sales price of $335,400 represented a 2.6 percent gain over the past year.
 Orders for durable goods jumped in December. The Census Bureau estimates new orders for manufactured durable goods grew for the fourth time in five months, growing 2.9 percent during the month to a seasonally adjusted $249.4 billion. Higher orders for transportation goods surged 7.4 percent, led by increased orders for defense aircraft (+55.3 percent), civilian aircraft (+15.9 percent), and motor vehicles (+0.4 percent). Net of transportation goods, core durable goods orders rose 0.6 percent, capturing order gains for primary metals (+1.4 percent), fabricated metals (+0.9 percent), and machinery (+0.6 percent). Orders declined for electrical equipment/appliances (-0.9 percent) and computers/electronics (-0.2 percent). Durable goods shipments increased for the seventh time in eight months (+0.6 percent to $246.8 billion). Unfilled orders gained 0.6 percent to $1.144 trillion (its fourth consecutive increase) while durable goods inventories expanded for the 17th time in 18 months (+0.3 percent to $406.5 billion).
Other U.S. economic data released over the past week:
– Jobless Claims (week ending January 20, 2018, First-Time Claims, seasonally adjusted): 233,000 (+17,000 vs. previous week; -19,000 vs. the same week a year earlier). 4-week moving average: 240,000 (-1.9% vs. the same week a year earlier).
– State Employment (December 2017, Nonfarm Payroll Employment, seasonally adjusted): Vs. November 2017: 10 states had significant payroll increases, 3 states had significant payroll decreases. Vs. December 2016: 25 states had significant payroll increases.
– FHFA House Price Index (November 2017, Purchase-Only Index, seasonally adjusted): +0.4% vs. October 2017, +6.5% vs. November 2016.
The opinions expressed here are not necessarily those of Kevin’s current employer. No endorsements are implied.
