
Q2 had more than twice the rate of GDP growth than there was during the first three months of 2017. Here are the five things we learned from U.S. economic data released during the week ending July 28.
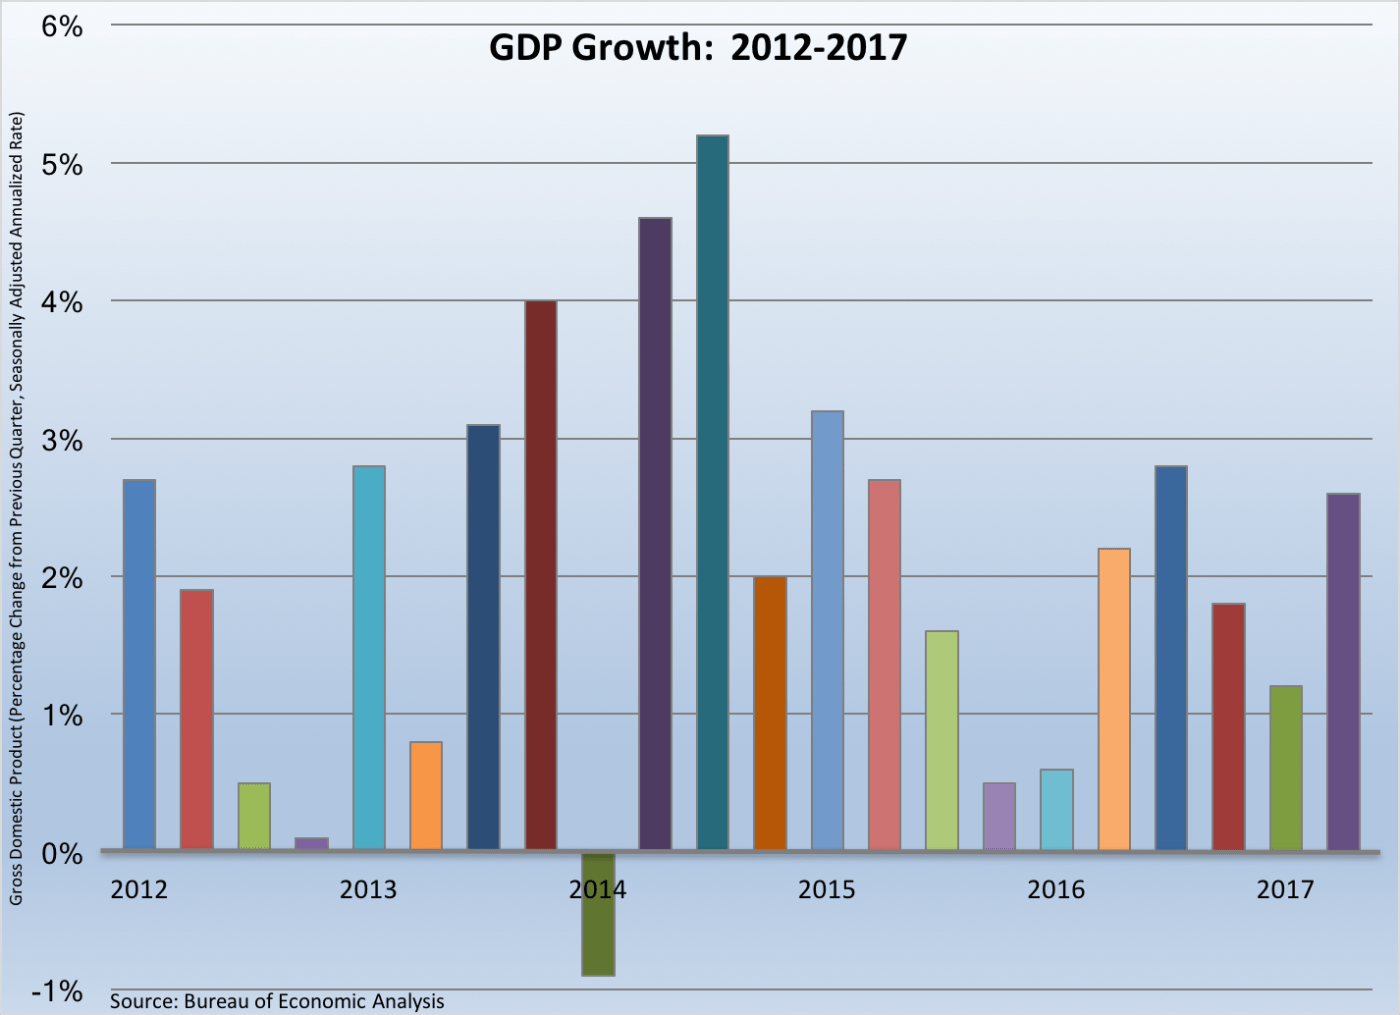
 Economic growth picked up during Q2. The Bureau of Economic Analysis indicates that Gross Domestic Product (GDP) grew 2.6 percent on a seasonally adjusted annualized rate (SAAR), up from a 1.2 percent annualized growth rate during Q1. This was the fastest pace of economic growth since the third quarter of last year and the second-best growth rate in two years. By far the biggest contributor to Q2 economic growth was consumer expenditures. The 2.8 percent annualized gain in personal consumption expenditures was responsible for 193-basis points in economic growth. Smaller contributions to economic expansion came from nonresidential fixed investment, net exports, and government expenditures. Dragging down GDP growth were residential fixed investment (housing) and the change in private business inventories. The same report contained the annual revisions to previously reported GDP growth rates, with the U.S. economy now believed to have grown 2.6 percent, 2.9 percent, and 1.9 percent in 2014, 2015, and 2016, respectively. This represented an upward revision for 2014 and 2015, but a downgrade for 2016. BEA will update its Q2 GDP estimate twice over the next two months.
 The Fed leaves its short-term interest rate target alone. The policy statement released following last week’s meeting of the Federal Open Market Committee (FOMC) notes that the “labor market has continued to strengthen and that economic activity has been rising moderately so far this year.” Further, while spending at households and business was growing, inflationary pressures had cooled below its two-percent target rate. As a result, the FOMC members voted unanimously to keep the fed funds target rate at a range between 1.00 and 1.25 percent following the quarter point hike at the previous meeting. The statement also said that the Federal Reserve would continue its policy to reinvest principal payments made on its agency debt and mortgage-back securities holdings “for the time being.” The words in the quotes are read by some to suggest that the policy will be rolled back as soon as the next FOMC meeting in September.
 Existing home sales cooled slightly in June while those of new homes crept up. The National Association of Realtors tells us that sales of previously owned homes decreased 1.8 percent during the month to a seasonally adjusted annualized rate (SAAR) of 5.52 million units. The SAAR has been within a tight range of 5.3 and 5.7 million units over the past year. Sales slowed during June in three of four Census regions: South (-4.7 percent), Northeast (-2.6 percent), and West (-0.8 percent). Existing home sales grew 3.1 percent during the month in the Midwest. Even with the decline, existing home sales were up 0.7 percent over the past year, although only two regions (West and Northeast) have positive 12-month comparables. Inventories remained very tight: the 1.96 million homes available for sale at the end of June was off 0.5 percent from May, 7.1 percent below the year ago count, and was the equivalent of a mere 4.3 month supply. As a result tight supply of homes for sale, the median sales price of $263,800 was 6.5 percent above that of a year earlier.
Per the Census Bureau, new home sales edged up 0.8 percent during the month to a seasonally adjusted annualized rate (SAAR) of 610,000 units, up 9.1 percent from a year earlier. New home sales gained in both the West (+12.5 percent) and Midwest (+10.0 percent), fell in the South (-6.1 percent), and held steady in the Northeast. Three of four Census regions have positive 12-month sales comparables: Northeast, West, and South. The count of new homes available for sale increased 1.1 percent to 272,000. Even though this was 11.9 percent above the number of homes on the market back in June 2016, it reflected a still tight 5.4 month supply.
 Durable goods orders rose in June as aircraft orders surged. The Census Bureau reports that new orders for durable manufactured goods totaled $245.6 billion, up 6.5 percent from May after two monthly declines. Orders for transportation goods jumped 19.0 percent as civilian aircraft orders blossomed by 131.2 percent (aircraft orders tend to be volatile month-to-month). Motor vehicle orders slipped 0.2 percent during June. Net of transportation goods, durable goods orders grew 0.2 percent during the month. Increasing during the month were new orders for communications equipment (+1.6 percent), fabricated metal products (+0.7 percent), machinery (+0.2 percent), and primary metals (+0.1 percent). Falling were new orders for electrical equipment/appliances (-1.7 percent), computers (-0.2 percent), and non-aircraft civilian capital goods (-0.1 percent).
 Two surveys show consumers are more confident about current business conditions than they have been in more than a decade. The Conference Board Consumer Confidence Index added 3.8 points in July to a seasonally adjusted reading of 121.1 (1985 = 100), its first increase in four months. Views improved for both current and expectation business conditions. The present situation index grew by 3.9 points to 147.8 (a 16-year high) while the expectations index added 3.7 points to 103.3. A third of survey respondents characterized current business conditions as “good” while only 13.5 percent saw them as “bad.” Similarly, 34.1 percent said that jobs were “plentiful” while 18.0 percent stated that they were “hard to get.” The press release noted that “consumers foresee the current economic expansion continuing well into the second half of this year.”
The Index of Consumer Sentiment from the University of Michigan declined 1.7 points in July to a seasonally adjusted reading of 93.4 (1966Q1 = 100). The same measure was at 90.0 a year earlier, but the index has lost 5.1 points since its postrecession peak in January. The index for current business conditions added 9/10ths of a point to 113.4, its highest reading since July 2005 (July 206: 109.0). The expectations index shed 3.4 points during the month to 80.5 (July 2016: 77.8). There were great differences in expectations by survey respondents’ political views: the expectations index for Republicans was 108.7 while that for Democrats was at 63.7.
Other U.S. economic data released over the past week:
– Jobless Claims (week ending July 22, 2017, First-Time Claims, seasonally adjusted): 244,000 (+10,000 vs. previous week; -19,000 vs. the same week a year earlier). 4-week moving average: 244,000 (-5.6% vs. the same week a year earlier).
– Chicago Fed National Activity Index (June 2017, Index (0.00=U.S. Economy Growing at its Historical Average, not seasonally adjusted): +0.13 (vs. May 2017: -0.30; vs. June 2016: +0.03).
– Case-Shiller Home Price Index (May 2017, 20-City Index, seasonally adjusted): +0.1 vs. April 2017, +5.7% vs. May 2016.
– FHFA House Price Index (May 2017, Purchase-Only Index, seasonally adjusted): +0.4% vs. April 2017, +6.9% vs. May 2016.
The opinions expressed here are not necessarily those of Kevin’s current and previous employers. No endorsements are implied.
