

Inflation made its presence felt in January while manufacturing output grew despite a decline in automobile production. Here are the 5 things we learned from U.S. economic data released during the week ending February 17.
 Both consumer and wholesale prices jumped during January. Per the Bureau of Labor Statistics, the Consumer Price Index (CPI) surged 0.6% on a seasonally adjusted basis during the month, its biggest 1-month gain since February 2013. Energy prices grew for a 5th straight month with a 4.0% increase as gasoline prices swelled 7.8% on a seasonally adjusted basis (without adjustments for seasonal variation, gas prices grew 5.3%). Other energy goods experiencing price increases during January included utility delivered natural gas (+1.5%) and fuel oil (+3.5%). Food prices grew for the 1st time since last April albeit with a tepid 0.1% gain. Net of energy and food, core CPI grew 0.3% during the month and had a 12-month comparable of +2.3%, which was above the Federal Reserve’s 2% inflation target rate. Rising during the month were prices for apparel (+1.4%), new vehicles (+0.9%), transportation services (+0.6%), and medical commodities (+0.3%).
Meanwhile, the Producer Price Index (PPI) for final demand goods and services jumped 0.6% on a seasonally adjusted basis during January. This was the wholesale price measure’s largest single-month increase since March 2011, leaving PPI 1.6% above its January 2016 reading. Net of the typically volatile prices for energy, food, and trade services, core PPI grew 0.2% during the month with a 12-month comparable of +1.6%. Wholesale prices for final demand goods rose 1.0% (its biggest single-month gain since last June), with 3/4ths of the gain attributed to a 4.7% surge in energy goods PPI (gasoline: +12.9%). Food prices were flat for the month. Net of energy and food, the core PPI measure for final demand gained 0.4% during January, led by price increases for pharmaceutical preparations and iron & steel scrap. Prices for final demand services jumped 0.3% as trade prices (i.e., retailer and wholesaler margins) increased 0.9%.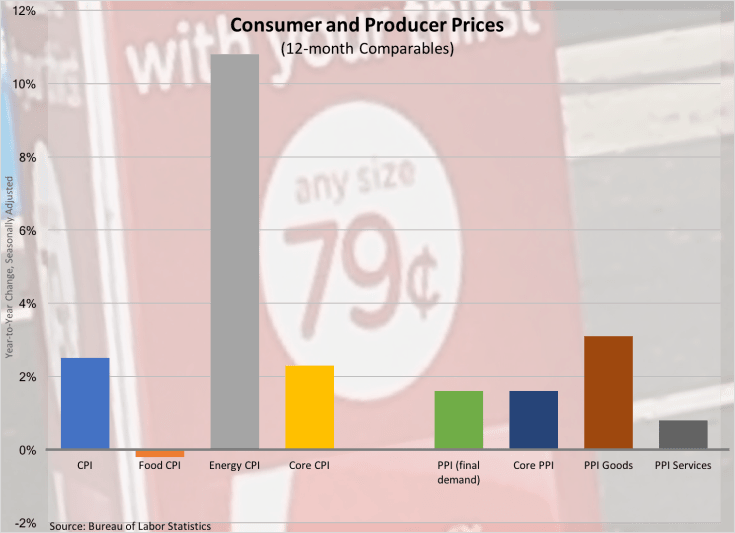
 Manufacturing output grew modestly in January. The Federal Reserve reports that manufacturing production increased 0.2% during the month and was 0.3% above its January 2016 pace. The increase in manufacturing output was held down by a 2.9% slowdown in automobile production—net of autos, manufacturing output rose 0.5% during the month. Outside of motor vehicles, most other categories of durable goods production increased during January with machinery manufacturing growing the most. Production of nondurables rose 0.6%, with gains exceeding 1.0% for textiles, petroleum/coal products, and chemicals. Overall industrial production slowed 0.3% during January as warm winter weather pulled down output at utilities by 5.7%. Mining output grew 2.8%. Factory utilization in manufacturing edged up 1/10th of a percentage point to 75.1%. Overall industrial capacity utilization, however, slipped 3/10ths of a percentage point to 75.3%.
 Retail sales started the new year on a strong note. The Census Bureau estimates retail and food services sales were at a seasonally adjusted $472.1 billion in January, up 0.4% from the prior month and 5.6% from a year earlier. (Note that the year-to-year comparable were helped a bit by a relatively weak sales report back in January 2016). Sales at auto dealers & parts stores fell 1.4% while those at gas stations surged 2.3% due to higher prices at the pump. Net of those two retailer classes, core retail sales grew 0.7% during January. Sales grew by at least 1% at sporting goods/hobby retailers (+1.8%), electronics/appliance stores (+1.6%), restaurants/bars (+1.4%), department stores (+1.2%), and apparel retailers (+1.0%). While sales at nonstore retailers (e.g., internet retailers) were unchanged for the month, they were a robust 12.0% above the January 2016 sales pace.
 Housing starts slowed during January. The Census Bureau estimates housing starts were at a seasonally adjusted annualized rate of 1.246 million units, down 2.6% from the December pace. Starts activity slowed sharply in both the West (-41.3%) and Midwest (-17.9%) but grew healthily in both the Northeast (+55.4%) and South (+20.0%). Even with January’s decline, housing starts were 10.5% ahead of their January 2016 pace, indicative of a still solid construction market. Starts of single-family units were at a SAAR of 823,000 units, up 1.9% for the month and 6.2% from a year earlier. Looking towards the future, there were 1.285 million issued residential construction permits (SAAR), +4.6% vs. December 2016 and +8.2% vs. January 2016. Housing completions slowed 5.6% during the month to 1.047 million units. This was off 0.9% from the January 2016 completions pace.
 Leading indicators signal economic expansion for the coming months. The Leading Economic Index from the Conference Board added 8/10ths of a point during January to a reading of 125.5 (2010 = 100). This was up 2.5% from a year earlier. 8 of the measure’s 10 components made positive contributions, led by the interest rate spread, building permits, and jobless claims. The coincident index edged up 1/10th of a point to 114.4 (+1.6 vs. January 2016). 3 of 4 coincident index components made positive contributions, including nonfarm payrolls and personal income net of transfer payments. The lagging index added 4/10ths of a point to 123.7 (+3.3% vs. January 2016), with 4 of 7 index components making a positive contribution. The press release noted should the indices’ trends continue, “the U.S. economy may accelerate in the near term.”
Other U.S. economic data released over the past week:
– Jobless Claims (week ending February 11, 2017, First-Time Claims, seasonally adjusted): 239,000 (+5,000 vs. previous week; -21,000 vs. the same week a year earlier). 4-week moving average: 244,250 (-9.2% vs. the same week a year earlier).
– Housing Market Index (February 2017, Index (Greater than 50 = “Good” Housing Market, seasonally adjusted): 65 (vs. January 2017: 67, vs. February 2016: 58).
– Small Business Optimism Index (January 2017, Index (1986 = 100), seasonally adjusted): 105.9 (vs. December 2016: 105.8, vs. January 2016: 93.9).
– Business Inventories (December 2016, Manufacturing & Trade Inventories, seasonally adjusted): $ 1.836 trillion (+0.4% vs. November 2016, +2.0% vs. December 2015).
– Treasury International Capital Data (December 2015, Net Foreign Purchases of U.S. Securities, not seasonally adjusted): -$13.9 billion (vs. November 2016: +$15.9 billion, vs. December 2015: -$43.4 billion).
The opinions expressed here are not necessarily those of Kevin’s current and previous employers. No endorsements are implied.
